


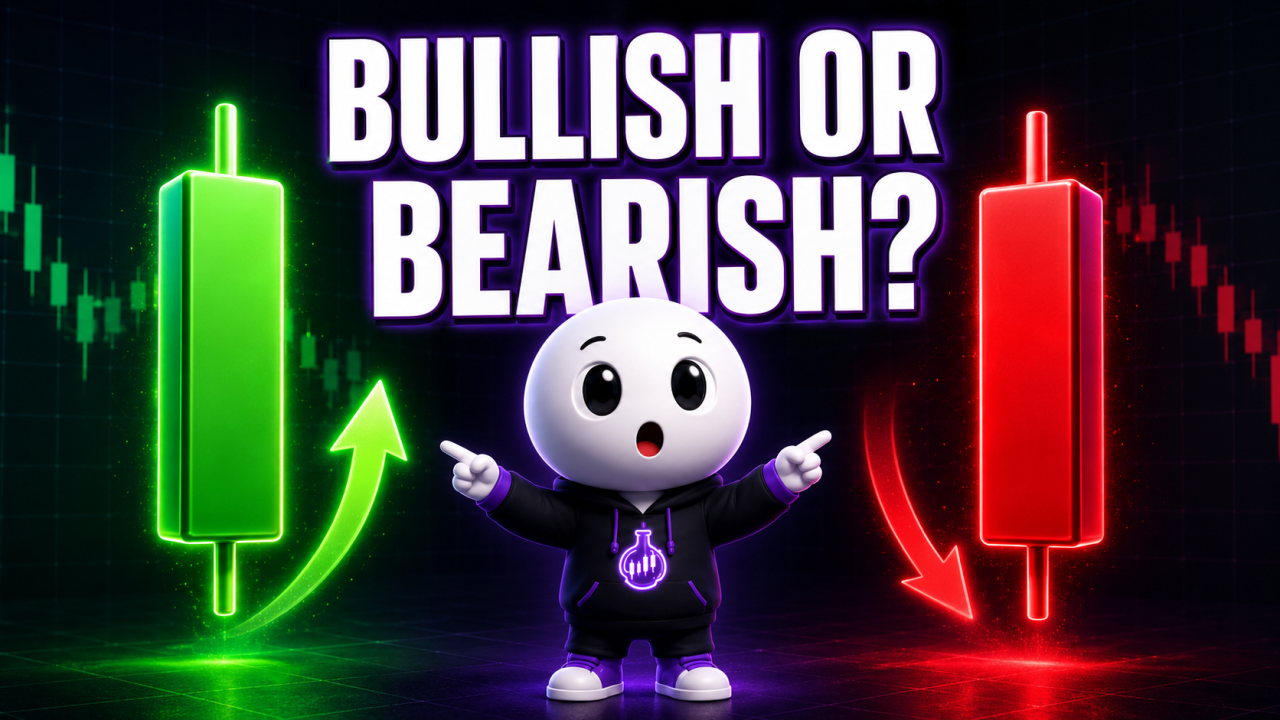
Bullish vs Bearish Candles Explained for Crypto Trading Beginners
Have you ever looked at a crypto chart and wondered why one candle is green, another is red, and the next one has long, thin lines sticking out of it?
Many beginners assume a green candle means buy and a red candle means sell. That sounds simple, but it can lead to costly misunderstandings. A candle tells you what price did during a specific period. It does not tell you with certainty what price will do next.
In this lesson, we will compare bullish and bearish candles, examine their essential parts, and learn how traders interpret them in context. We will also explore realistic crypto examples, confirmation methods, common mistakes, risk management, and how candlestick information connects to TradingView and Pine Script.
This lesson is for educational purposes only. Cryptocurrency trading involves risk, and no candle or pattern can guarantee a profitable result.
Let us begin with a simple definition.
A candlestick is a visual summary of price movement during a selected period. Think of it as a short report describing a small chapter of the market.
Every completed candle contains four important prices: the open, high, low, and close.
The open is the price at the beginning of the period. The high is the highest price reached. The low is the lowest price reached. The close is the final price when that period ends.
A bullish candle forms when the closing price is higher than the opening price. It shows that price finished the period above where it began.
A bearish candle forms when the closing price is lower than the opening price. It shows that price finished below where it began.
On many charts, bullish candles are green and bearish candles are red. However, those colors are only visual settings. Traders can customize them. The mathematical definition depends on the relationship between the open and close, not the displayed color.
The wide area between the open and close is called the real body, or simply the body. A long bullish body shows a relatively large upward move during that candle. A long bearish body shows a relatively large downward move.
The thin lines above and below the body are commonly called wicks or shadows. The upper wick reaches the candle’s high, while the lower wick reaches its low.
Wicks show that price visited a level but did not close there. For example, a long upper wick means price moved higher during the period and then pulled back before the candle closed. A long lower wick means price moved lower and then recovered before the close.
This information can reveal a struggle between buyers and sellers, but it must be interpreted carefully. A long lower wick is not automatically bullish, and a long upper wick is not automatically bearish. Location, trend, timeframe, volume, and surrounding candles all matter.
Now imagine a hypothetical Bitcoin candle on a one-hour chart.
Suppose the candle opens at 60,000 dollars. During the hour, Bitcoin falls to 59,700, rises to 60,800, and closes at 60,600.
The open is 60,000. The high is 60,800. The low is 59,700. The close is 60,600.
Because the close is higher than the open, this is a bullish candle. Its body extends from 60,000 to 60,600. It also has an upper wick reaching 60,800 and a lower wick reaching 59,700.
This candle tells us that Bitcoin experienced movement in both directions, but it finished the hour above its opening price. It does not prove that the next candle will also move higher.
Now consider a hypothetical Ethereum candle.
Suppose Ethereum opens at 3,200 dollars, reaches a high of 3,240, drops to 3,100, and closes at 3,130.
Because the closing price is below the opening price, this is a bearish candle. The candle shows that Ethereum finished the period lower, even though price briefly traded above the open.
A beginner might see this bearish candle and immediately sell. A more careful trader asks additional questions.
Is Ethereum already near an established support area? Is the broader trend rising or falling? Is the candle unusually large because of temporary volatility? Has the candle actually closed? What does volume show? What happens during the following candles?
These questions introduce the most important principle of candlestick analysis: context.
First, consider the trend. A bullish candle in an established uptrend may support the existing upward direction. The same bullish candle inside a strong downtrend could be only a temporary bounce.
Similarly, a bearish candle in a downtrend may agree with the broader direction. A bearish candle during an uptrend might represent an ordinary pullback rather than a complete reversal.
Second, examine support and resistance.
Support is an area where buying interest has previously been strong enough to slow or reverse a decline. Resistance is an area where selling interest has previously slowed or reversed an advance.
A bullish candle closing strongly above resistance may be more meaningful than a bullish candle appearing randomly in the middle of a range. However, even a breakout can fail. Some traders wait for an additional close, a successful retest, or another form of confirmation.
A bearish candle closing below support may suggest weakness, but price can quickly recover above that area. That is why reacting before the candle closes can be risky.
An active candle continues changing until its timeframe ends. A candle that looks strongly bullish halfway through an hour may become bearish before the hour closes. Waiting for the close provides confirmed open, high, low, and close values for that period, although it still does not guarantee the next move.
Third, consider volume. Volume measures trading activity during a period. A decisive candle accompanied by relatively high volume may attract more attention because greater participation occurred during the move.
Low volume does not automatically invalidate a candle, and high volume does not guarantee continuation. Volume should be compared with recent activity on the same market and timeframe.
Timeframe also changes the meaning of what you see.
A bullish five-minute candle describes only five minutes of price action. It may exist inside a bearish one-hour candle, which may itself be part of a bullish daily trend. These observations are not contradictions. They describe different periods.
Many traders begin with a higher timeframe to understand the broader structure, then use a lower timeframe for more detailed analysis. Switching between timeframes without a clear method can create confusion, so decide which timeframe controls your main trading idea.
Bullish and bearish candles also come in different shapes.
A long body with short wicks suggests that price moved strongly toward the close with limited recovery in the opposite direction. A small body means the open and close were close together, even if price moved widely during the period.
When the open and close are nearly equal, the candle is often called a doji. A doji can show hesitation or balance during that period, but it is not automatically a reversal signal.
A candle with a small body and long lower wick may show that lower prices were rejected during the period. Near support and after a decline, traders may view this as potentially bullish information. In a different location, it may have little importance.
A small body with a long upper wick may show rejection of higher prices. Near resistance after an advance, that can provide potentially bearish information. Once again, confirmation is important.
Here is a practical example.
Imagine Bitcoin has been moving sideways between hypothetical support near 60,000 dollars and resistance near 62,000. Price approaches 62,000 and forms one green candle.
Buying solely because the candle is green would be an incorrect interpretation. Price is still near resistance, and the candle may not have closed above the range.
A trader could instead watch whether a completed candle closes clearly above resistance, whether activity increases, and whether price can remain above or retest that level. This does not remove risk, but it creates a more structured decision.
Now imagine price falls toward 60,000 and creates a red candle with a long lower wick. The correct interpretation is not that the red color automatically means further decline. The candle shows that price closed below its open but recovered from its lowest point.
A trader might watch the next candle, the support area, market structure, and volume before deciding whether the recovery has meaningful confirmation.
Candles provide evidence, not commands. Traders may use them to identify momentum, rejection, breakouts, pullbacks, or possible changes in market behavior. They can then define conditions that would support or invalidate an idea.
This is where TradingView and Pine Script become useful.
On a TradingView chart, you can select a timeframe, inspect open, high, low, and close values, customize candle colors, draw support and resistance, and add volume or other indicators.
Pine Script can evaluate candlestick conditions mathematically. For example, a script can identify when the close is above the open, calculate body and wick sizes, or create an alert when a bullish candle closes above a chosen resistance level.
A strategy script can backtest defined historical rules, such as entering only when a bullish candle closes above a moving average with specified risk controls. Backtesting helps examine how rules behaved on historical data, but it cannot guarantee future performance. Results can also be affected by fees, slippage, market selection, timeframe, and unrealistic assumptions.
Let us cover several common beginner mistakes.
The first mistake is treating every green candle as a buy signal and every red candle as a sell signal. Candle direction describes the completed period. It does not predict the next one.
The second mistake is ignoring the candle close. An unfinished candle can change shape, direction, and wick length before the period ends.
The third mistake is analyzing one candle in isolation. Always consider nearby price structure, trend, support, resistance, volume, and volatility.
The fourth mistake is ignoring timeframe. A strong-looking one-minute candle may have little importance within a major daily move.
The fifth mistake is assuming a long wick guarantees a reversal. A wick shows rejection or recovery during that period, but price may test the same level again or continue through it.
The sixth mistake is chasing an unusually large candle. Entering after a sharp move can create a poor entry because the logical invalidation point may be far away.
The seventh mistake is searching for perfect-looking examples and assuming every real chart will look the same. Live market structures are often less clean than examples in educational diagrams.
Good risk management remains necessary even when the analysis looks convincing.
Before entering a trade, define what evidence would invalidate the idea. That invalidation level may help with stop-loss planning, but it should be based on market structure and the trading method rather than an arbitrary distance.
Position size should reflect the distance between the entry and stop, as well as the amount of account risk the trader is prepared to accept. A wider stop generally requires a smaller position if account risk is kept consistent.
Also compare the potential risk with the realistic potential reward. A valid candlestick observation does not automatically create a worthwhile trade. Sometimes the best decision is to wait or take no position.
Let us summarize.
A bullish candle closes above its open. A bearish candle closes below its open. The body represents the distance between open and close, while the wicks show the period’s highest and lowest prices.
Candle color alone is not a trading signal. Interpret candles using their location, completed close, trend, timeframe, support, resistance, volume, volatility, and surrounding price action.
Most importantly, remember that candlesticks provide information, not certainty. Combine clear rules with confirmation, invalidation planning, position sizing, and responsible risk management.
Follow PineScriptLab for more beginner-friendly lessons about crypto trading, TradingView, Pine Script, indicators, strategies, backtesting, alerts, and trading automation. In the comments, tell us which topic we should explain next: candle wicks, doji candles, support and resistance, or candlestick patterns?




Comments (0)
No comments found