


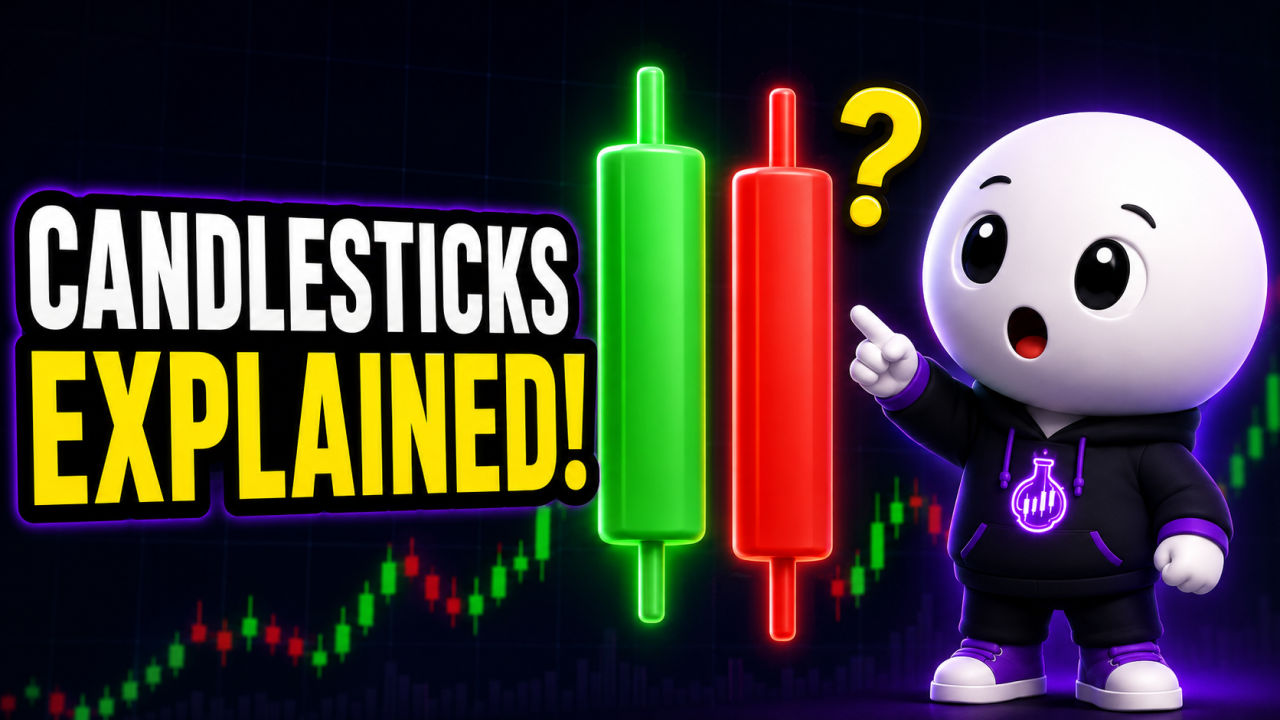
What is a Candlestick? Crypto Trading Basics for Beginners
Have you ever opened a crypto chart and felt confused by all the green and red candles moving up and down?
Maybe you saw Bitcoin pumping, Ethereum dropping, or an altcoin forming strange candle shapes, and you asked yourself, “What do these candles actually mean?”
In this video, we are going to explain one of the most important basics in trading: the candlestick.
By the end of this lesson, you will understand what a candlestick is, what open, high, low, and close mean, the difference between bullish and bearish candles, what candle bodies and wicks tell you, and how traders use candles to understand price action.
This lesson is beginner-friendly, so we will keep everything simple, visual, and practical.
Before we begin, a quick reminder: this video is for educational purposes only. It is not financial advice. Trading crypto involves risk, so always do your own research and use proper risk management.
Now let’s start.
A candlestick is a visual representation of price movement during a specific period of time.
That sounds technical, but the idea is simple.
A candle shows what happened to the price within a selected timeframe.
For example, if you are looking at a 1-minute chart, each candle shows what happened during one minute.
If you are looking at a 5-minute chart, each candle shows what happened during five minutes.
If you are looking at a 1-hour chart, each candle shows what happened during one hour.
And if you are looking at a daily chart, each candle shows what happened during one full day.
So every candle is like a small story. It tells us how price moved between buyers and sellers during that time.
Imagine you are watching Bitcoin on a 1-hour chart. One candle represents one hour of activity. During that hour, price started at one level, moved up, moved down, and finally ended at another level.
That information is shown in one candle.
This is why candlesticks are useful. Instead of reading a long list of prices, traders can look at the chart and quickly understand price movement.
Now let’s break down the four main parts of a candlestick.
Every candlestick gives us four important prices: open, high, low, and close.
The open is the price where the candle started.
The high is the highest price reached during that candle.
The low is the lowest price reached during that candle.
The close is the price where the candle ended.
So every candle answers four questions.
- Where did price start?
- How high did price go?
- How low did price drop?
- Where did price end?
These four values are very important because many indicators, strategies, and TradingView scripts are based on open, high, low, and close data.
In Pine Script, you will often see these values written as open, high, low, and close.
That means if you understand candlesticks, you are also starting to understand the foundation of many TradingView indicators and strategies.
Now let’s talk about green and red candles.
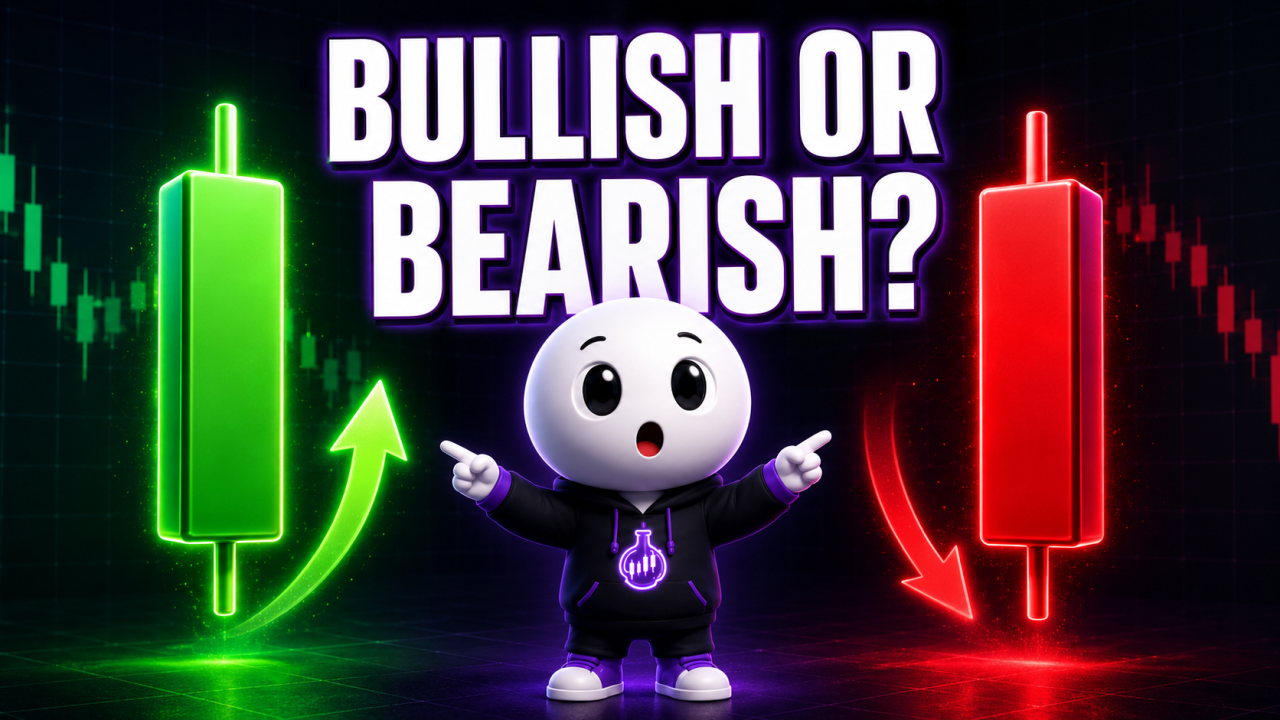
A green candle is usually called a bullish candle.
A bullish candle means the price closed higher than it opened.
For example, if Bitcoin opened at 60,000 dollars and closed at 61,000 dollars, that candle is bullish because price ended higher than where it started.
This usually shows that buyers were stronger during that candle.
On the other hand, a red candle is usually called a bearish candle.
A bearish candle means the price closed lower than it opened.
For example, if Ethereum opened at 3,000 dollars and closed at 2,900 dollars, that candle is bearish because price ended lower than where it started.
This usually shows that sellers were stronger during that candle.
But here is something very important.
A green candle does not always mean you should buy.
And a red candle does not always mean you should sell.
Many beginners make this mistake. They see a big green candle and immediately think, “This is going up. I should enter now.”
But sometimes, that green candle is already too late. Price may be near resistance, and the move may be exhausted.
The same is true with red candles. A red candle does not automatically mean the market will continue falling. Sometimes price is already near support, and buyers may step in.
That is why context matters.
Candlesticks are powerful, but they should not be read alone. You need to look at the trend, support and resistance, volume, and overall market structure.
Now let’s talk about the body and the wick.
The thick part of the candle is called the body.
The body shows the distance between the open and close.
If the body is big, it means price moved strongly in one direction.
A big green body shows strong buying pressure.
A big red body shows strong selling pressure.
If the body is small, it means price did not move much between the open and close. This can show indecision in the market.
It means buyers and sellers were fighting, but neither side clearly won during that candle.
Now look at the thin lines above and below the body. These are called wicks or shadows.
The upper wick shows how high price tried to go before pulling back.
The lower wick shows how low price tried to drop before bouncing back.
Wicks are important because they show rejection or reaction.
For example, imagine price moves up and creates a long upper wick. This means buyers pushed price higher, but sellers came in and pushed it back down before the candle closed.
That can be a sign of rejection from above.
Now imagine price moves down and creates a long lower wick. This means sellers pushed price lower, but buyers stepped in and pushed price back up before the candle closed.
That can be a sign of rejection from below.
Again, this does not guarantee what will happen next. It only gives traders a clue.
A long upper wick near resistance may suggest that sellers are defending that area.
A long lower wick near support may suggest that buyers are defending that area.
This is why candlesticks become more useful when combined with support and resistance.
Now let’s talk about timeframes.
A candlestick can represent different amounts of time depending on the chart setting.
- On a 1-minute chart, every candle shows one minute of price movement.
- On a 15-minute chart, every candle shows fifteen minutes.
- On a 1-hour chart, every candle shows one hour.
- On a daily chart, every candle shows one day.
The same candle shape can have different meaning depending on the timeframe.
For example, a bullish candle on the 1-minute chart may only show a small short-term move.
But a bullish candle on the daily chart may show stronger market activity because it represents an entire day of trading.
This is why many traders use multiple timeframes.
They might check the daily chart to understand the bigger trend, then use the 1-hour or 15-minute chart to look for entries.
But beginners should be careful.
Do not jump between too many timeframes without a plan. This can create confusion.
You might see a bullish candle on the 5-minute chart, but a bearish structure on the 1-hour chart.
That is why it is important to decide your trading style first.
- Are you scalping?
- Are you day trading?
- Are you swing trading?
Your timeframe should match your trading plan.
Now let’s discuss how traders actually use candlesticks.
Traders use candlesticks to understand price action.
Price action simply means reading the movement of price itself.
Candlesticks can help traders identify market direction, momentum, rejection zones, possible reversals, breakouts, and pullbacks.
For example, if price is making higher highs and higher lows, and candles are mostly closing strong, the market may be in an uptrend.
If price is making lower highs and lower lows, and candles are mostly closing weak, the market may be in a downtrend.
If candles are small and moving sideways, the market may be ranging or waiting for a breakout.
Candlesticks can also help identify momentum.
A series of large green candles may show strong bullish momentum.
A series of large red candles may show strong bearish momentum.
But once again, do not chase candles blindly.
Strong movement can continue, but it can also reverse quickly, especially in crypto.
Crypto markets can be volatile. Price can move fast in both directions.
That is why risk management is important.
Now let’s introduce a few common candlestick patterns for beginners.
The first one is the doji candle.
A doji has a very small body. This means the open and close are almost the same.
A doji can show indecision because buyers and sellers pushed price around, but the candle ended near where it started.
The second one is the hammer candle.
A hammer usually has a small body and a long lower wick.
This may show that sellers pushed price down, but buyers stepped in and pushed price back up.
A hammer near support can be a clue that buyers are reacting.
The third one is the shooting star.
A shooting star usually has a small body and a long upper wick.
This may show that buyers pushed price up, but sellers rejected the move.
A shooting star near resistance can be a clue that sellers are reacting.
The fourth one is the engulfing candle.
A bullish engulfing candle happens when a strong green candle covers or “engulfs” the previous red candle.
A bearish engulfing candle happens when a strong red candle covers the previous green candle.
These patterns can be useful, but here is the key lesson: candlestick patterns should not be used alone.
A hammer candle in the middle of nowhere may not mean much.
But a hammer candle at a strong support level, during a healthy pullback, with good volume, may be more meaningful.
Context is everything.
Now let’s go through a simple crypto example.
Imagine Bitcoin is in an uptrend.
Price is moving higher, then it starts to pull back.
The price reaches a support area where buyers previously stepped in.
At that support area, Bitcoin forms a candle with a long lower wick.
What does that tell us?
It tells us that sellers pushed price down during that candle, but buyers reacted and pushed price back up before the candle closed.
Does this guarantee that Bitcoin will go up?
No.
But it gives traders a clue that support may be holding.
A beginner might use this as a reason to watch closely, not to blindly enter.
A more prepared trader may wait for confirmation, such as the next candle closing bullish, a break above a small resistance, or increased buying volume.
This is how candlesticks help traders make better observations.
They do not predict the future perfectly, but they help you understand what buyers and sellers are doing.
Now let’s connect this to PineScriptLab.
At PineScriptLab, we talk about TradingView, Pine Script, indicators, strategies, alerts, backtesting, and automation.
But before you build an indicator or automate a strategy, you need to understand the data behind it.
And the foundation is candlestick data.
Most TradingView indicators use open, high, low, close, and volume.
Moving averages are based on closing prices.
RSI is calculated from price movement.
MACD comes from moving averages.
Breakout alerts often depend on price closing above or below a level.
Stop loss and take profit logic often use candle highs and lows.
Even trading bots need candle data to make decisions.
So if you understand candlesticks, you are building the foundation for everything else.
You will understand charts better.
You will understand indicators better.
You will understand backtesting better.
And when you start learning Pine Script, the logic will make more sense.
For example, if a strategy says, “Enter when close is above resistance,” you will understand that the close price matters because it confirms where the candle ended.
If a strategy says, “Place stop loss below the previous low,” you will understand that the low is the lowest point reached by that candle.
This is why candlesticks are not just basic. They are essential.
Now let’s review the common mistakes beginners make with candlesticks.
Mistake number one: entering just because one candle is green.
A green candle may show buying pressure, but it does not always mean a good entry.
Mistake number two: selling immediately because one candle is red.
A red candle may show selling pressure, but it does not always mean the trend is finished.
Mistake number three: ignoring support and resistance.
Candles become more meaningful when you know where they are forming.
Mistake number four: using patterns without confirmation.
A candlestick pattern is not magic. It is only a clue.
Mistake number five: trading on very small timeframes without experience.
Small timeframes can produce many signals, but many of them can be noise.
Mistake number six: forgetting risk management.
Even if your candle reading is correct, the market can still move against you.
That is why every trade needs a plan.
Before entering, ask yourself:
- Where is my entry?
- Where is my stop loss?
- Where is my target?
- What is my risk-reward ratio?
- What will I do if the trade fails?
Good trading is not just about reading candles. It is about building a complete decision-making process.
So let’s summarize.
A candlestick shows price movement during a specific time period.
Each candle has four important values: open, high, low, and close.
A bullish candle closes higher than it opened.
A bearish candle closes lower than it opened.
The body shows the distance between open and close.
The wicks show the highest and lowest prices reached during that candle.
Long wicks can show rejection or strong market reaction.
Timeframes matter because one candle can represent one minute, one hour, one day, or more.
Candlesticks are useful for reading trend, momentum, support, resistance, breakouts, pullbacks, and possible reversals.
But candles should not be used alone. Always combine them with context, confirmation, and risk management.
And most importantly, understanding candlesticks gives you a strong foundation before learning indicators, TradingView alerts, Pine Script strategies, and crypto trading automation.
That’s why this is one of the first lessons every beginner trader should learn.



Comments (0)
No comments found