

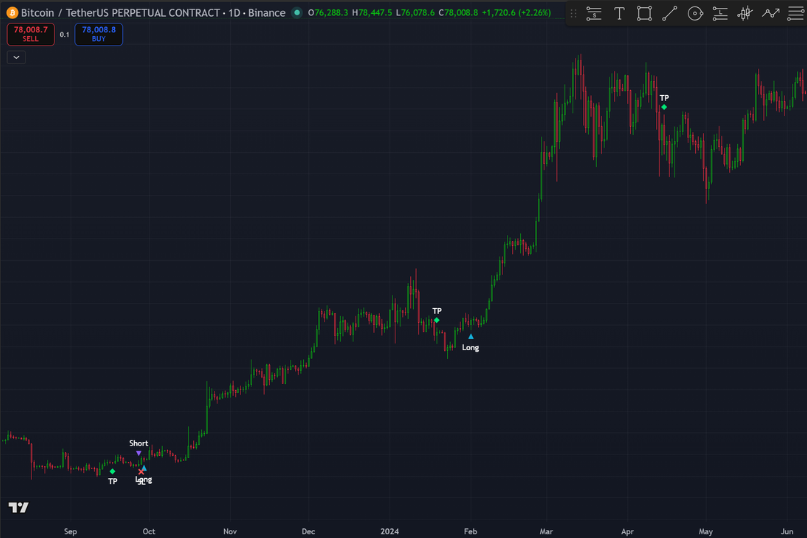
PSLAB: BTC Trend Strategy is a premium BTC strategy for traders who want more than signalsâÂÂthey want structure.
Designed for the Daily timeframe, this system combines momentum-based trend logic with oscillator confirmation for entries and exits to create a disciplined framework for participating in BTC trends. It is built for traders who want a cleaner process, more consistent execution behavior, and stronger risk awareness.
Key trade management features include stop loss protection, optional take profit, breakeven handling after favorable run-up, and selective trade participation designed to reduce unnecessary exposure during certain streak conditions. The strategy also allows you to operate in long-only, short-only, or two-way trading mode, depending on your market approach.
It can be used for both spot and futures trading, with a recommended maximum of 10x leverage for futures users who want to keep risk at a more manageable level.
This is a strong fit for traders who want a premium, rules-based BTC strategy focused on structure, discipline, and usabilityâÂÂnot noise, hype, or overtrading.
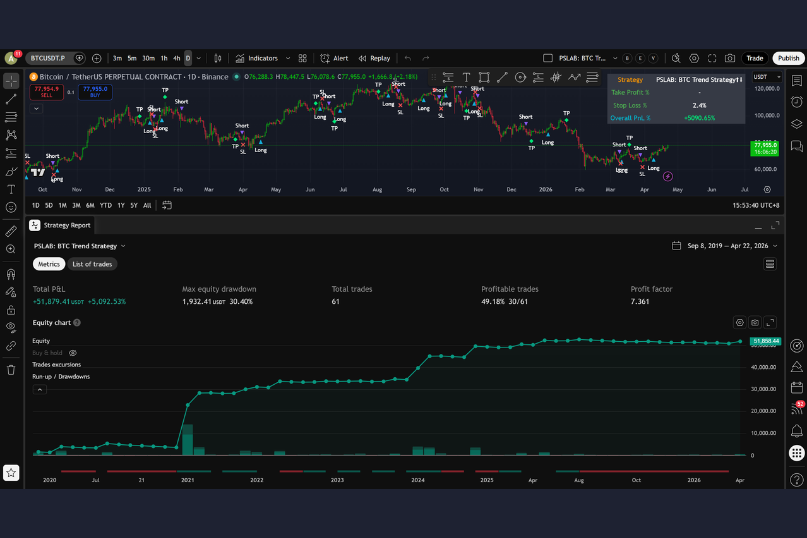
Backtesting Information
Historical performance metrics
Promising preset for aggressive traders who accept lower win rates and target larger payoff moves. Best used with patient swing/position execution and consistent risk sizing. Expect uneven win/loss sequences; follow the rules consistently.
Enter your order size and leverage to calculate performance metrics based on the uploaded trading data.
Based on backtests from Nov 12, 2019 to Mar 18, 2026
Basic Information
Core backtest configuration
Trade Statistics
Win/loss and holding behavior
Profit/Loss Summary
Performance highlights and risk
Capital Analysis
Survival buffer for drawdown
Streak Information
Winning and losing patterns
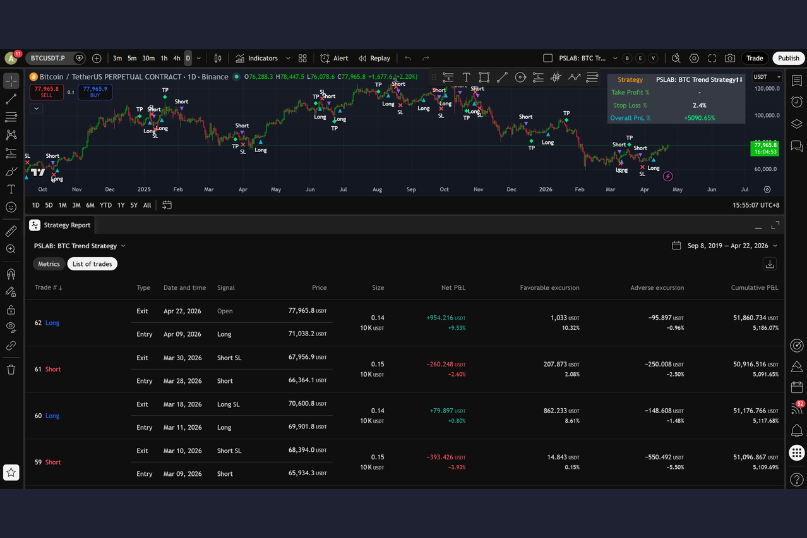
| Trade # ↓ | Type | Date and time | Signal | Price | Position Size | Net P&L | Cumulative Drawdown | Profit at New Peak | Cumulative P&L |
|---|---|---|---|---|---|---|---|---|---|
| 68 Long | Exit | Mar 18, 2026 | Long SL | 70,600.8 USDT | 0.143058 (10,000.00 USDT) | 79.90 USDT (+0.80%) | -1,313.52 USDT (-131.35%) | - | 49,524.00 USDT (4,952.40%) |
| Entry | Mar 11, 2026 | Long | 69,901.8 USDT | ||||||
| 67 Short | Exit | Mar 10, 2026 | Short SL | 68,394 USDT | 0.151667 (10,000.00 USDT) | -393.42 USDT (-3.93%) | -1,393.42 USDT (-139.34%) | - | 49,444.10 USDT (4,944.41%) |
| Entry | Mar 09, 2026 | Short | 65,934.3 USDT | ||||||
| 66 Long | Exit | Jan 20, 2026 | Long SL | 90,851 USDT | 0.111172 (10,000.00 USDT) | 79.90 USDT (+0.80%) | -1,000.00 USDT (-100.00%) | - | 49,837.52 USDT (4,983.75%) |
| Entry | Jan 03, 2026 | Long | 89,951.5 USDT | ||||||
| 65 Short | Exit | Dec 19, 2025 | Short SL | 89,289.4 USDT | 0.110876 (10,000.00 USDT) | 80.10 USDT (+0.80%) | -1,079.90 USDT (-107.99%) | - | 49,757.62 USDT (4,975.76%) |
| Entry | Dec 14, 2025 | Short | 90,191.3 USDT | ||||||
| 64 Short | Exit | Nov 01, 2025 | Short SL | 110,428.9 USDT | 0.092368 (10,000.00 USDT) | -220.20 USDT (-2.20%) | -1,160.00 USDT (-116.00%) | - | 49,677.52 USDT (4,967.75%) |
| Entry | Oct 31, 2025 | Short | 108,263.6 USDT | ||||||
| 63 Long | Exit | Oct 29, 2025 | Long SL | 111,782.9 USDT | 0.08767 (10,000.00 USDT) | -219.80 USDT (-2.20%) | -939.80 USDT (-93.98%) | - | 49,897.72 USDT (4,989.77%) |
| Entry | Oct 28, 2025 | Long | 114,064.2 USDT | ||||||
| 62 Short | Exit | Oct 21, 2025 | Short SL | 111,854.1 USDT | 0.088509 (10,000.00 USDT) | 80.10 USDT (+0.80%) | -720.00 USDT (-72.00%) | - | 50,117.52 USDT (5,011.75%) |
| Entry | Oct 15, 2025 | Short | 112,983.9 USDT | ||||||
| 61 Long | Exit | Oct 09, 2025 | Long SL | 119,737.5 USDT | 0.084352 (10,000.00 USDT) | 79.90 USDT (+0.80%) | -800.10 USDT (-80.01%) | - | 50,037.42 USDT (5,003.74%) |
| Entry | Oct 02, 2025 | Long | 118,552 USDT | ||||||
| 60 Short | Exit | Sep 28, 2025 | Short SL | 111,113.3 USDT | 0.091799 (10,000.00 USDT) | -220.20 USDT (-2.20%) | -880.00 USDT (-88.00%) | - | 49,957.52 USDT (4,995.75%) |
| Entry | Sep 26, 2025 | Short | 108,934.6 USDT | ||||||
| 59 Long | Exit | Sep 22, 2025 | Long SL | 113,118.4 USDT | 0.086635 (10,000.00 USDT) | -219.80 USDT (-2.20%) | -659.80 USDT (-65.98%) | - | 50,177.72 USDT (5,017.77%) |
| Entry | Sep 12, 2025 | Long | 115,427 USDT | ||||||
| 58 Short | Exit | Aug 22, 2025 | Short SL | 115,080.6 USDT | 0.088634 (10,000.00 USDT) | -220.20 USDT (-2.20%) | -440.00 USDT (-44.00%) | - | 50,397.52 USDT (5,039.75%) |
| Entry | Aug 20, 2025 | Short | 112,824.1 USDT | ||||||
| 57 Long | Exit | Aug 15, 2025 | Long SL | 116,870.1 USDT | 0.083854 (10,000.00 USDT) | -219.80 USDT (-2.20%) | -219.80 USDT (-21.98%) | - | 50,617.72 USDT (5,061.77%) |
| Entry | Aug 11, 2025 | Long | 119,255.3 USDT | ||||||
| 56 Long | Exit | Aug 02, 2025 | Long Exit | 113,244.8 USDT | 0.093449 (10,000.00 USDT) | 562.00 USDT (+5.62%) | - | 422.30 USDT (42.23%) | 50,837.52 USDT (5,083.75%) |
| Entry | Jun 28, 2025 | Long | 107,010.6 USDT | ||||||
| 55 Short | Exit | Jun 23, 2025 | Short SL | 103,463 USDT | 0.095687 (10,000.00 USDT) | 80.10 USDT (+0.80%) | -139.70 USDT (-13.97%) | - | 50,275.52 USDT (5,027.55%) |
| Entry | Jun 18, 2025 | Short | 104,508 USDT | ||||||
| 54 Long | Exit | Jun 11, 2025 | Long SL | 108,023.4 USDT | 0.090722 (10,000.00 USDT) | -219.80 USDT (-2.20%) | -219.80 USDT (-21.98%) | - | 50,195.42 USDT (5,019.54%) |
| Entry | Jun 10, 2025 | Long | 110,228 USDT | ||||||
| 53 Long | Exit | Jun 06, 2025 | Long Exit | 101,458.7 USDT | 0.119062 (10,000.00 USDT) | 2,057.77 USDT (+20.58%) | - | 1,837.57 USDT (183.76%) | 50,415.22 USDT (5,041.52%) |
| Entry | Apr 17, 2025 | Long | 83,990.1 USDT | ||||||
| 52 Short | Exit | Apr 01, 2025 | Short SL | 84,000.2 USDT | 0.121429 (10,000.00 USDT) | -220.20 USDT (-2.20%) | -220.20 USDT (-22.02%) | - | 48,357.45 USDT (4,835.75%) |
| Entry | Mar 31, 2025 | Short | 82,353.1 USDT | ||||||
| 51 Short | Exit | Mar 25, 2025 | Short Exit | 87,463.4 USDT | 0.098723 (10,000.00 USDT) | 1,346.73 USDT (+13.47%) | - | 952.07 USDT (95.21%) | 48,577.65 USDT (4,857.77%) |
| Entry | Feb 04, 2025 | Short | 101,293.6 USDT | ||||||
| 50 Long | Exit | Jan 20, 2025 | Long SL | 100,936.7 USDT | 0.100063 (10,000.00 USDT) | 79.90 USDT (+0.80%) | -394.66 USDT (-39.47%) | - | 47,230.92 USDT (4,723.09%) |
| Entry | Jan 17, 2025 | Long | 99,937.4 USDT | ||||||
| 49 Short | Exit | Jan 11, 2025 | Short SL | 94,675.6 USDT | 0.108102 (10,000.00 USDT) | -254.76 USDT (-2.55%) | -474.56 USDT (-47.46%) | - | 47,151.02 USDT (4,715.10%) |
| Entry | Jan 10, 2025 | Short | 92,506 USDT | ||||||
| 48 Long | Exit | Jan 07, 2025 | Long SL | 96,373.3 USDT | 0.101688 (10,000.00 USDT) | -219.80 USDT (-2.20%) | -219.80 USDT (-21.98%) | - | 47,405.78 USDT (4,740.58%) |
| Entry | Jan 06, 2025 | Long | 98,340.2 USDT | ||||||
| 47 Long | Exit | Dec 28, 2024 | Long Exit | 94,258.9 USDT | 0.159136 (10,000.00 USDT) | 4,974.89 USDT (+49.75%) | - | 4,534.85 USDT (453.49%) | 47,625.58 USDT (4,762.56%) |
| Entry | Oct 14, 2024 | Long | 62,839.7 USDT | ||||||
| 46 Short | Exit | Oct 11, 2024 | Short SL | 61,818.5 USDT | 0.165 (10,000.00 USDT) | -220.22 USDT (-2.20%) | -440.04 USDT (-44.00%) | - | 42,650.69 USDT (4,265.07%) |
| Entry | Oct 10, 2024 | Short | 60,606.3 USDT | ||||||
| 45 Long | Exit | Sep 17, 2024 | Long SL | 57,918.4 USDT | 0.169204 (10,000.00 USDT) | -219.82 USDT (-2.20%) | -219.82 USDT (-21.98%) | - | 42,870.91 USDT (4,287.09%) |
| Entry | Sep 16, 2024 | Long | 59,100.5 USDT | ||||||
| 44 Short | Exit | Sep 12, 2024 | Short SL | 58,352.5 USDT | 0.169659 (10,000.00 USDT) | 80.10 USDT (+0.80%) | - | 80.10 USDT (8.01%) | 43,090.73 USDT (4,309.07%) |
| Entry | Sep 01, 2024 | Short | 58,941.9 USDT | ||||||
| 43 Long | Exit | Jun 14, 2024 | Long SL | 65,869.8 USDT | 0.153333 (10,000.00 USDT) | 79.88 USDT (+0.80%) | - | 79.88 USDT (7.99%) | 43,010.63 USDT (4,301.06%) |
| Entry | May 17, 2024 | Long | 65,217.7 USDT | ||||||
| 42 Long | Exit | Apr 15, 2024 | Long Exit | 65,615.9 USDT | 0.23496 (10,000.00 USDT) | 5,391.68 USDT (+53.92%) | - | 5,391.68 USDT (539.17%) | 42,930.75 USDT (4,293.08%) |
| Entry | Feb 01, 2024 | Long | 42,560.5 USDT | ||||||
| 41 Long | Exit | Jan 19, 2024 | Long Exit | 41,323.2 USDT | 0.37021 (10,000.00 USDT) | 5,272.97 USDT (+52.73%) | - | 5,052.77 USDT (505.28%) | 37,539.07 USDT (3,753.91%) |
| Entry | Sep 29, 2023 | Long | 27,011.7 USDT | ||||||
| 40 Short | Exit | Sep 28, 2023 | Short SL | 26,732.9 USDT | 0.381553 (10,000.00 USDT) | -220.20 USDT (-2.20%) | -220.20 USDT (-22.02%) | - | 32,266.10 USDT (3,226.61%) |
| Entry | Sep 27, 2023 | Short | 26,208.7 USDT | ||||||
| 39 Short | Exit | Sep 17, 2023 | Short Exit | 26,547 USDT | 0.335057 (10,000.00 USDT) | 1,086.36 USDT (+10.86%) | - | 669.02 USDT (66.90%) | 32,486.30 USDT (3,248.63%) |
| Entry | Jul 19, 2023 | Short | 29,845.7 USDT | ||||||
| 38 Long | Exit | Jul 14, 2023 | Long SL | 30,288.3 USDT | 0.333462 (10,000.00 USDT) | 79.88 USDT (+0.80%) | -417.34 USDT (-41.73%) | - | 31,399.94 USDT (3,139.99%) |
| Entry | Jun 22, 2023 | Long | 29,988.5 USDT | ||||||
| 37 Short | Exit | May 10, 2023 | Short SL | 28,213 USDT | 0.361536 (10,000.00 USDT) | -220.20 USDT (-2.20%) | -497.22 USDT (-49.72%) | - | 31,320.06 USDT (3,132.01%) |
| Entry | May 09, 2023 | Short | 27,659.8 USDT | ||||||
| 36 Long | Exit | May 01, 2023 | Long SL | 28,714 USDT | 0.341297 (10,000.00 USDT) | -219.80 USDT (-2.20%) | -277.02 USDT (-27.70%) | - | 31,540.26 USDT (3,154.03%) |
| Entry | Apr 29, 2023 | Long | 29,300 USDT | ||||||
| 35 Short | Exit | Mar 13, 2023 | Short SL | 23,222.6 USDT | 0.426311 (10,000.00 USDT) | 80.06 USDT (+0.80%) | -57.22 USDT (-5.72%) | - | 31,760.06 USDT (3,176.01%) |
| Entry | Mar 03, 2023 | Short | 23,457.1 USDT | ||||||
| 34 Long | Exit | Feb 22, 2023 | Long SL | 23,761.8 USDT | 0.425051 (10,000.00 USDT) | 79.88 USDT (+0.80%) | -137.28 USDT (-13.73%) | - | 31,680.00 USDT (3,168.00%) |
| Entry | Feb 17, 2023 | Long | 23,526.6 USDT | ||||||
| 33 Short | Exit | Jan 07, 2023 | Short Exit | 16,943.9 USDT | 0.594541 (10,000.00 USDT) | -93.92 USDT (-0.94%) | -217.16 USDT (-21.72%) | - | 31,600.12 USDT (3,160.01%) |
| Entry | Dec 22, 2022 | Short | 16,819.7 USDT | ||||||
| 32 Short | Exit | Dec 04, 2022 | Short Exit | 16,879.5 USDT | 0.56857 (10,000.00 USDT) | 383.24 USDT (+3.83%) | -123.24 USDT (-12.32%) | - | 31,694.04 USDT (3,169.40%) |
| Entry | Nov 11, 2022 | Short | 17,588 USDT | ||||||
| 31 Long | Exit | Nov 08, 2022 | Long SL | 20,268.9 USDT | 0.498299 (10,000.00 USDT) | 79.86 USDT (+0.80%) | -506.48 USDT (-50.65%) | - | 31,310.80 USDT (3,131.08%) |
| Entry | Oct 26, 2022 | Long | 20,068.3 USDT | ||||||
| 30 Short | Exit | Oct 14, 2022 | Short SL | 19,365.4 USDT | 0.522901 (10,000.00 USDT) | -146.30 USDT (-1.46%) | -586.34 USDT (-58.63%) | - | 31,230.94 USDT (3,123.09%) |
| Entry | Oct 11, 2022 | Short | 19,124.1 USDT | ||||||
| 29 Long | Exit | Oct 06, 2022 | Long SL | 19,926.2 USDT | 0.491814 (10,000.00 USDT) | -219.82 USDT (-2.20%) | -440.04 USDT (-44.00%) | - | 31,377.24 USDT (3,137.72%) |
| Entry | Oct 05, 2022 | Long | 20,332.9 USDT | ||||||
| 28 Short | Exit | Aug 23, 2022 | Short SL | 21,550.3 USDT | 0.473313 (10,000.00 USDT) | -220.22 USDT (-2.20%) | -220.22 USDT (-22.02%) | - | 31,597.06 USDT (3,159.71%) |
| Entry | Aug 21, 2022 | Short | 21,127.7 USDT | ||||||
| 27 Short | Exit | Jul 18, 2022 | Short Exit | 20,794.4 USDT | 0.343907 (10,000.00 USDT) | 2,831.52 USDT (+28.32%) | - | 1,731.26 USDT (173.13%) | 31,817.28 USDT (3,181.73%) |
| Entry | Jun 11, 2022 | Short | 29,077.7 USDT | ||||||
| 26 Long | Exit | Mar 20, 2022 | Long SL | 40,916.5 USDT | 0.239512 (10,000.00 USDT) | -219.82 USDT (-2.20%) | -1,100.26 USDT (-110.03%) | - | 28,985.76 USDT (2,898.58%) |
| Entry | Mar 19, 2022 | Long | 41,751.6 USDT | ||||||
| 25 Short | Exit | Mar 08, 2022 | Short SL | 39,169.2 USDT | 0.26041 (10,000.00 USDT) | -220.22 USDT (-2.20%) | -880.44 USDT (-88.04%) | - | 29,205.58 USDT (2,920.56%) |
| Entry | Mar 07, 2022 | Short | 38,401.1 USDT | ||||||
| 24 Long | Exit | Mar 03, 2022 | Long SL | 43,505.7 USDT | 0.225258 (10,000.00 USDT) | -219.80 USDT (-2.20%) | -660.22 USDT (-66.02%) | - | 29,425.80 USDT (2,942.58%) |
| Entry | Mar 02, 2022 | Long | 44,393.6 USDT | ||||||
| 23 Short | Exit | Feb 23, 2022 | Short SL | 39,135.3 USDT | 0.260635 (10,000.00 USDT) | -220.20 USDT (-2.20%) | -440.42 USDT (-44.04%) | - | 29,645.60 USDT (2,964.56%) |
| Entry | Feb 21, 2022 | Short | 38,367.9 USDT | ||||||
| 22 Short | Exit | Dec 31, 2021 | Short SL | 48,472.5 USDT | 0.210429 (10,000.00 USDT) | -220.22 USDT (-2.20%) | -220.22 USDT (-22.02%) | - | 29,865.80 USDT (2,986.58%) |
| Entry | Dec 29, 2021 | Short | 47,522 USDT | ||||||
| 21 Long | Exit | Nov 19, 2021 | Long Exit | 56,921 USDT | 0.207521 (10,000.00 USDT) | 1,790.47 USDT (+17.90%) | - | 1,380.72 USDT (138.07%) | 30,086.02 USDT (3,008.60%) |
| Entry | Oct 04, 2021 | Long | 48,188 USDT | ||||||
| 20 Short | Exit | Sep 22, 2021 | Short SL | 42,596.4 USDT | 0.232415 (10,000.00 USDT) | 80.08 USDT (+0.80%) | -409.75 USDT (-40.98%) | - | 28,295.55 USDT (2,829.56%) |
| Entry | Sep 21, 2021 | Short | 43,026.6 USDT | ||||||
| 19 Long | Exit | Sep 20, 2021 | Long SL | 46,790.6 USDT | 0.209444 (10,000.00 USDT) | -219.82 USDT (-2.20%) | -489.83 USDT (-48.98%) | - | 28,215.47 USDT (2,821.55%) |
| Entry | Sep 17, 2021 | Long | 47,745.6 USDT | ||||||
| 18 Short | Exit | Sep 14, 2021 | Short SL | 46,969 USDT | 0.217165 (10,000.00 USDT) | -220.21 USDT (-2.20%) | -270.01 USDT (-27.00%) | - | 28,435.29 USDT (2,843.53%) |
| Entry | Sep 13, 2021 | Short | 46,048 USDT | ||||||
| 17 Short | Exit | Jun 21, 2021 | Short SL | 35,588.6 USDT | 0.281826 (10,000.00 USDT) | -49.80 USDT (-0.50%) | -49.80 USDT (-4.98%) | - | 28,655.50 USDT (2,865.55%) |
| Entry | Jun 20, 2021 | Short | 35,483 USDT | ||||||
| 16 Long | Exit | Apr 07, 2021 | Long SL | 56,386.2 USDT | 0.179122 (10,000.00 USDT) | 79.88 USDT (+0.80%) | - | 79.88 USDT (7.99%) | 28,705.30 USDT (2,870.53%) |
| Entry | Mar 28, 2021 | Long | 55,828 USDT | ||||||
| 15 Long | Exit | Mar 27, 2021 | Long Exit | 55,030 USDT | 0.281658 (10,000.00 USDT) | 5,474.11 USDT (+54.74%) | - | 5,474.11 USDT (547.41%) | 28,625.42 USDT (2,862.54%) |
| Entry | Feb 03, 2021 | Long | 35,504.1 USDT | ||||||
| 14 Long | Exit | Jan 24, 2021 | Long Exit | 32,086.5 USDT | 0.915793 (10,000.00 USDT) | 19,345.20 USDT (+193.45%) | - | 17,675.38 USDT (1,767.54%) | 23,151.31 USDT (2,315.13%) |
| Entry | Oct 09, 2020 | Long | 10,919.5 USDT | ||||||
| 13 Short | Exit | Oct 05, 2020 | Short SL | 10,776.8 USDT | 0.946486 (10,000.00 USDT) | -220.29 USDT (-2.20%) | -1,669.82 USDT (-166.98%) | - | 3,806.11 USDT (380.61%) |
| Entry | Oct 03, 2020 | Short | 10,565.4 USDT | ||||||
| 12 Long | Exit | Oct 01, 2020 | Long SL | 10,478 USDT | 0.935288 (10,000.00 USDT) | -219.85 USDT (-2.20%) | -1,449.53 USDT (-144.95%) | - | 4,026.40 USDT (402.64%) |
| Entry | Sep 29, 2020 | Long | 10,691.9 USDT | ||||||
| 11 Short | Exit | Sep 24, 2020 | Short SL | 10,733.8 USDT | 0.950273 (10,000.00 USDT) | -220.24 USDT (-2.20%) | -1,229.68 USDT (-122.97%) | - | 4,246.25 USDT (424.63%) |
| Entry | Sep 23, 2020 | Short | 10,523.3 USDT | ||||||
| 10 Long | Exit | Sep 21, 2020 | Long SL | 10,851.7 USDT | 0.903082 (10,000.00 USDT) | -219.83 USDT (-2.20%) | -1,009.44 USDT (-100.94%) | - | 4,466.49 USDT (446.65%) |
| Entry | Sep 20, 2020 | Long | 11,073.2 USDT | ||||||
| 9 Short | Exit | Sep 05, 2020 | Short SL | 10,448 USDT | 0.986058 (10,000.00 USDT) | -322.63 USDT (-3.23%) | -789.61 USDT (-78.96%) | - | 4,686.32 USDT (468.63%) |
| Entry | Sep 04, 2020 | Short | 10,141.4 USDT | ||||||
| 8 Long | Exit | Sep 03, 2020 | Long SL | 11,396.4 USDT | 0.838209 (10,000.00 USDT) | -466.98 USDT (-4.67%) | -466.98 USDT (-46.70%) | - | 5,008.95 USDT (500.90%) |
| Entry | Sep 02, 2020 | Long | 11,930.2 USDT | ||||||
| 7 Long | Exit | Aug 27, 2020 | Long Exit | 11,466.2 USDT | 1.050608 (10,000.00 USDT) | 2,024.42 USDT (+20.24%) | - | 1,514.42 USDT (151.44%) | 5,475.93 USDT (547.59%) |
| Entry | Jul 23, 2020 | Long | 9,518.3 USDT | ||||||
| 6 Long | Exit | Jul 15, 2020 | Long Exit | 9,254.2 USDT | 1.075188 (10,000.00 USDT) | -69.94 USDT (-0.70%) | -510.00 USDT (-51.00%) | - | 3,451.51 USDT (345.15%) |
| Entry | Jul 13, 2020 | Long | 9,300.7 USDT | ||||||
| 5 Short | Exit | Jun 22, 2020 | Short SL | 9,610.5 USDT | 1.061346 (10,000.00 USDT) | -220.26 USDT (-2.20%) | -440.06 USDT (-44.01%) | - | 3,521.45 USDT (352.15%) |
| Entry | Jun 16, 2020 | Short | 9,422 USDT | ||||||
| 4 Long | Exit | May 30, 2020 | Long SL | 9,378.2 USDT | 1.044976 (10,000.00 USDT) | -219.80 USDT (-2.20%) | -219.80 USDT (-21.98%) | - | 3,741.71 USDT (374.17%) |
| Entry | May 29, 2020 | Long | 9,569.6 USDT | ||||||
| 3 Long | Exit | Feb 26, 2020 | Long Exit | 9,326 USDT | 1.359731 (10,000.00 USDT) | 2,658.16 USDT (+26.58%) | - | 2,437.90 USDT (243.79%) | 3,961.51 USDT (396.15%) |
| Entry | Jan 06, 2020 | Long | 7,354.4 USDT | ||||||
| 2 Short | Exit | Jan 03, 2020 | Short SL | 7,341.6 USDT | 1.389353 (10,000.00 USDT) | -220.26 USDT (-2.20%) | -220.26 USDT (-22.03%) | - | 1,303.35 USDT (130.34%) |
| Entry | Jan 02, 2020 | Short | 7,197.6 USDT | ||||||
| 1 Short | Exit | Dec 30, 2019 | Short Exit | 7,383.7 USDT | 1.145489 (10,000.00 USDT) | 1,523.61 USDT (+15.24%) | - | 1,523.61 USDT (152.36%) | 1,523.61 USDT (152.36%) |
| Entry | Nov 12, 2019 | Short | 8,729.9 USDT | ||||||
| Month | trades | Wins | Losses | Win Rate | Profit | Cumulative Drawdown | Profit at New Peak | Cumulative P&L |
|---|---|---|---|---|---|---|---|---|
| Mar 2026 | 2 | 1 | 1 | 50.00% | -313.52 | -873.52 | - | 49,523.96 |
| Feb 2026 | 0 | 0 | 0 | 0.00% | - | -560.00 | - | 49,837.48 |
| Jan 2026 | 1 | 1 | 0 | 100.00% | 79.90 | -560.00 | - | 49,837.48 |
| Dec 2025 | 1 | 1 | 0 | 100.00% | 80.10 | -639.90 | - | 49,757.58 |
| Nov 2025 | 1 | 0 | 1 | 0.00% | -220.20 | -720.00 | - | 49,677.48 |
| Oct 2025 | 3 | 2 | 1 | 66.67% | -59.80 | -499.80 | - | 49,897.68 |
| Sep 2025 | 2 | 0 | 2 | 0.00% | -440.00 | -440.00 | - | 49,957.48 |
| Aug 2025 | 3 | 1 | 2 | 33.33% | 122.00 | - | 122.00 | 50,397.48 |
| Jul 2025 | 0 | 0 | 0 | 0.00% | - | - | - | 50,275.49 |
| Jun 2025 | 3 | 2 | 1 | 66.67% | 1,918.07 | - | 1,697.87 | 50,275.49 |
| May 2025 | 0 | 0 | 0 | 0.00% | - | -220.20 | - | 48,357.42 |
| Apr 2025 | 1 | 0 | 1 | 0.00% | -220.20 | -220.20 | - | 48,357.42 |
| Mar 2025 | 1 | 1 | 0 | 100.00% | 1,346.73 | - | 952.07 | 48,577.62 |
| Feb 2025 | 0 | 0 | 0 | 0.00% | - | -394.67 | - | 47,230.89 |
| Jan 2025 | 3 | 1 | 2 | 33.33% | -394.67 | -394.67 | - | 47,230.89 |
| Dec 2024 | 1 | 1 | 0 | 100.00% | 4,974.89 | - | 4,614.95 | 47,625.55 |
| Nov 2024 | 0 | 0 | 0 | 0.00% | - | -359.94 | - | 42,650.66 |
| Oct 2024 | 1 | 0 | 1 | 0.00% | -220.22 | -359.94 | - | 42,650.66 |
| Sep 2024 | 2 | 1 | 1 | 50.00% | -139.72 | -139.72 | - | 42,870.88 |
| Aug 2024 | 0 | 0 | 0 | 0.00% | - | - | - | 43,010.60 |
| Jul 2024 | 0 | 0 | 0 | 0.00% | - | - | - | 43,010.60 |
| Jun 2024 | 1 | 1 | 0 | 100.00% | 79.88 | - | 79.88 | 43,010.60 |
| May 2024 | 0 | 0 | 0 | 0.00% | - | - | - | 42,930.72 |
| Apr 2024 | 1 | 1 | 0 | 100.00% | 5,391.68 | - | 5,391.68 | 42,930.72 |
| Mar 2024 | 0 | 0 | 0 | 0.00% | - | - | - | 37,539.05 |
| Feb 2024 | 0 | 0 | 0 | 0.00% | - | - | - | 37,539.05 |
| Jan 2024 | 1 | 1 | 0 | 100.00% | 5,272.97 | - | 5,272.97 | 37,539.05 |
| Dec 2023 | 0 | 0 | 0 | 0.00% | - | - | - | 32,266.08 |
| Nov 2023 | 0 | 0 | 0 | 0.00% | - | - | - | 32,266.08 |
| Oct 2023 | 0 | 0 | 0 | 0.00% | - | - | - | 32,266.08 |
| Sep 2023 | 2 | 1 | 1 | 50.00% | 866.16 | - | 448.82 | 32,266.08 |
| Aug 2023 | 0 | 0 | 0 | 0.00% | - | -417.34 | - | 31,399.92 |
| Jul 2023 | 1 | 1 | 0 | 100.00% | 79.88 | -417.34 | - | 31,399.92 |
| Jun 2023 | 0 | 0 | 0 | 0.00% | - | -497.22 | - | 31,320.04 |
| May 2023 | 2 | 0 | 2 | 0.00% | -440.00 | -497.22 | - | 31,320.04 |
| Apr 2023 | 0 | 0 | 0 | 0.00% | - | -57.22 | - | 31,760.04 |
| Mar 2023 | 1 | 1 | 0 | 100.00% | 80.06 | -57.22 | - | 31,760.04 |
| Feb 2023 | 1 | 1 | 0 | 100.00% | 79.88 | -137.28 | - | 31,679.98 |
| Jan 2023 | 1 | 0 | 1 | 0.00% | -93.92 | -217.16 | - | 31,600.10 |
| Dec 2022 | 1 | 1 | 0 | 100.00% | 383.24 | -123.24 | - | 31,694.02 |
| Nov 2022 | 1 | 1 | 0 | 100.00% | 79.86 | -506.48 | - | 31,310.78 |
| Oct 2022 | 2 | 0 | 2 | 0.00% | -366.12 | -586.34 | - | 31,230.92 |
| Sep 2022 | 0 | 0 | 0 | 0.00% | - | -220.22 | - | 31,597.04 |
| Aug 2022 | 1 | 0 | 1 | 0.00% | -220.22 | -220.22 | - | 31,597.04 |
| Jul 2022 | 1 | 1 | 0 | 100.00% | 2,831.52 | - | 1,731.25 | 31,817.26 |
| Jun 2022 | 0 | 0 | 0 | 0.00% | - | -1,100.27 | - | 28,985.74 |
| May 2022 | 0 | 0 | 0 | 0.00% | - | -1,100.27 | - | 28,985.74 |
| Apr 2022 | 0 | 0 | 0 | 0.00% | - | -1,100.27 | - | 28,985.74 |
| Mar 2022 | 3 | 0 | 3 | 0.00% | -659.84 | -1,100.27 | - | 28,985.74 |
| Feb 2022 | 1 | 0 | 1 | 0.00% | -220.20 | -440.42 | - | 29,645.58 |
| Jan 2022 | 0 | 0 | 0 | 0.00% | - | -220.22 | - | 29,865.78 |
| Dec 2021 | 1 | 0 | 1 | 0.00% | -220.22 | -220.22 | - | 29,865.78 |
| Nov 2021 | 1 | 1 | 0 | 100.00% | 1,790.47 | - | 1,380.71 | 30,086.01 |
| Oct 2021 | 0 | 0 | 0 | 0.00% | - | -409.76 | - | 28,295.54 |
| Sep 2021 | 3 | 1 | 2 | 33.33% | -359.96 | -409.76 | - | 28,295.54 |
| Aug 2021 | 0 | 0 | 0 | 0.00% | - | -49.80 | - | 28,655.49 |
| Jul 2021 | 0 | 0 | 0 | 0.00% | - | -49.80 | - | 28,655.49 |
| Jun 2021 | 1 | 0 | 1 | 0.00% | -49.80 | -49.80 | - | 28,655.49 |
| May 2021 | 0 | 0 | 0 | 0.00% | - | - | - | 28,705.29 |
| Apr 2021 | 1 | 1 | 0 | 100.00% | 79.88 | - | 79.88 | 28,705.29 |
| Mar 2021 | 1 | 1 | 0 | 100.00% | 5,474.11 | - | 5,474.11 | 28,625.41 |
| Feb 2021 | 0 | 0 | 0 | 0.00% | - | - | - | 23,151.30 |
| Jan 2021 | 1 | 1 | 0 | 100.00% | 19,345.20 | - | 17,675.37 | 23,151.30 |
| Dec 2020 | 0 | 0 | 0 | 0.00% | - | -1,669.83 | - | 3,806.10 |
| Nov 2020 | 0 | 0 | 0 | 0.00% | - | -1,669.83 | - | 3,806.10 |
| Oct 2020 | 2 | 0 | 2 | 0.00% | -440.15 | -1,669.83 | - | 3,806.10 |
| Sep 2020 | 4 | 0 | 4 | 0.00% | -1,229.68 | -1,229.68 | - | 4,246.25 |
| Aug 2020 | 1 | 1 | 0 | 100.00% | 2,024.42 | - | 1,514.42 | 5,475.93 |
| Jul 2020 | 1 | 0 | 1 | 0.00% | -69.94 | -510.00 | - | 3,451.51 |
| Jun 2020 | 1 | 0 | 1 | 0.00% | -220.26 | -440.06 | - | 3,521.45 |
| May 2020 | 1 | 0 | 1 | 0.00% | -219.80 | -219.80 | - | 3,741.71 |
| Apr 2020 | 0 | 0 | 0 | 0.00% | - | - | - | 3,961.51 |
| Mar 2020 | 0 | 0 | 0 | 0.00% | - | - | - | 3,961.51 |
| Feb 2020 | 1 | 1 | 0 | 100.00% | 2,658.16 | - | 2,437.90 | 3,961.51 |
| Jan 2020 | 1 | 0 | 1 | 0.00% | -220.26 | -220.26 | - | 1,303.35 |
| Dec 2019 | 1 | 1 | 0 | 100.00% | 1,523.61 | - | 1,523.61 | 1,523.61 |
| Nov 2019 | 0 | 0 | 0 | 0.00% | - | - | - | - |
| Year | trades | Wins | Losses | Win Rate | Profit | Cumulative Drawdown | Profit at New Peak | Cumulative P&L |
|---|---|---|---|---|---|---|---|---|
| 2026 | 3 | 2 | 1 | 66.67% | -233.62 | -233.62 | - | 49,523.96 |
| 2025 | 18 | 8 | 10 | 44.44% | 2,132.03 | - | 2,132.03 | 49,757.58 |
| 2024 | 7 | 5 | 2 | 71.43% | 15,359.48 | - | 15,359.48 | 47,625.55 |
| 2023 | 8 | 4 | 4 | 50.00% | 572.06 | - | 572.06 | 32,266.08 |
| 2022 | 10 | 3 | 7 | 30.00% | 1,828.23 | - | 1,828.23 | 31,694.02 |
| 2021 | 9 | 5 | 4 | 55.56% | 26,059.68 | - | 26,059.68 | 29,865.78 |
| 2020 | 12 | 2 | 10 | 16.67% | 2,282.50 | - | 2,282.50 | 3,806.10 |
| 2019 | 1 | 1 | 0 | 100.00% | 1,523.61 | - | 1,523.61 | 1,523.61 |


Subscribe → submit TradingView username → approval → add script + alerts.
Choose a plan based on how many strategies you want access to.
We use it to grant access to invite-only scripts included in your plan.
Your request is reviewed, then your plan's strategies are enabled for your username.
Add the strategy to your chart, then create alerts for manual trading or webhook automation.
Use this script as part of a rule-based trading workflow. Subscribe to unlock disciplined Pine Scripts, cleaner signal tools, and alert-ready setups built for consistent execution.
Premium TradingView Pine Scripts
Everything you need to know about PinescriptLab
Stop guessing. Use rule-based Pine Scripts for TradingView—designed for cleaner signals, consistent execution, and alert-ready workflows.
Disclaimer: Educational only, not financial advice. Trading involves risk. Past performance is not indicative of future results.