

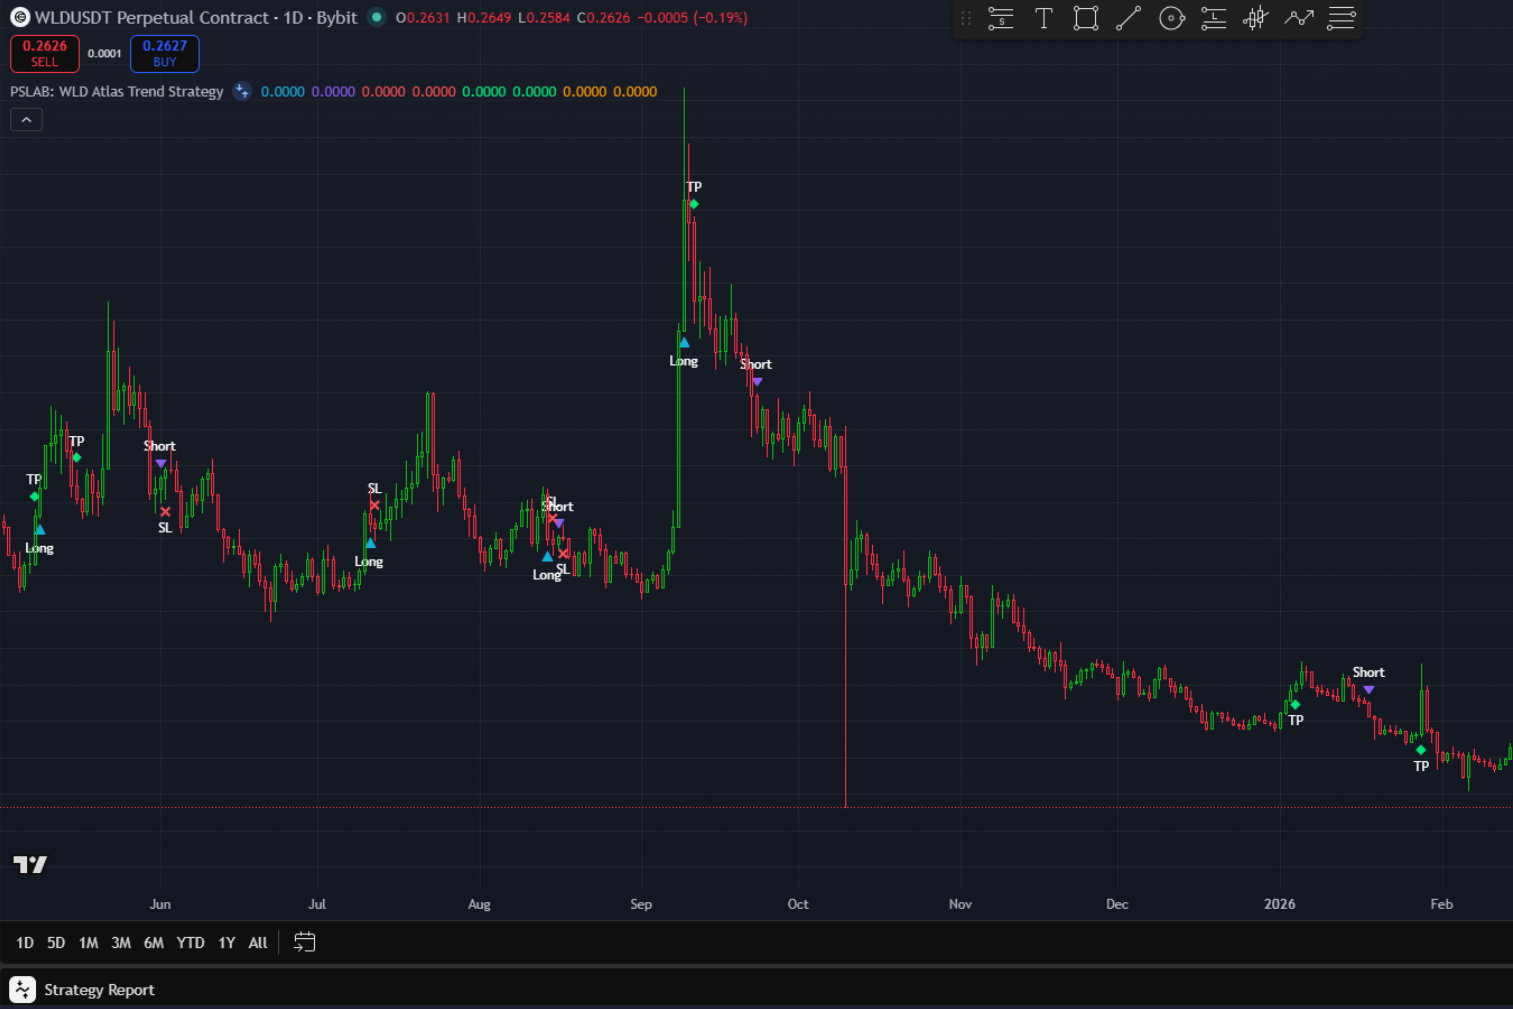
PSLAB: WLD Atlas Trend Strategy is a premium daily WLD trading strategy created for traders who want a more structured and rules-based framework for market participation.
It uses momentum-based trend logic with oscillator confirmation for entries and exits and is built for higher-timeframe trend-following. Suitable for both spot and futures trading, the strategy supports both directions, such as long and short, while maintaining a disciplined execution model.
The strategy includes stop loss protection, optional take profit, breakeven logic, momentum-based exits, trade-skipping logic, and alert-ready notifications for key trade events. It is designed for traders who value structure, usability, and controlled execution rather than hype or guesswork.
This is a premium strategy for serious traders who want a practical and systematic WLD trend framework.
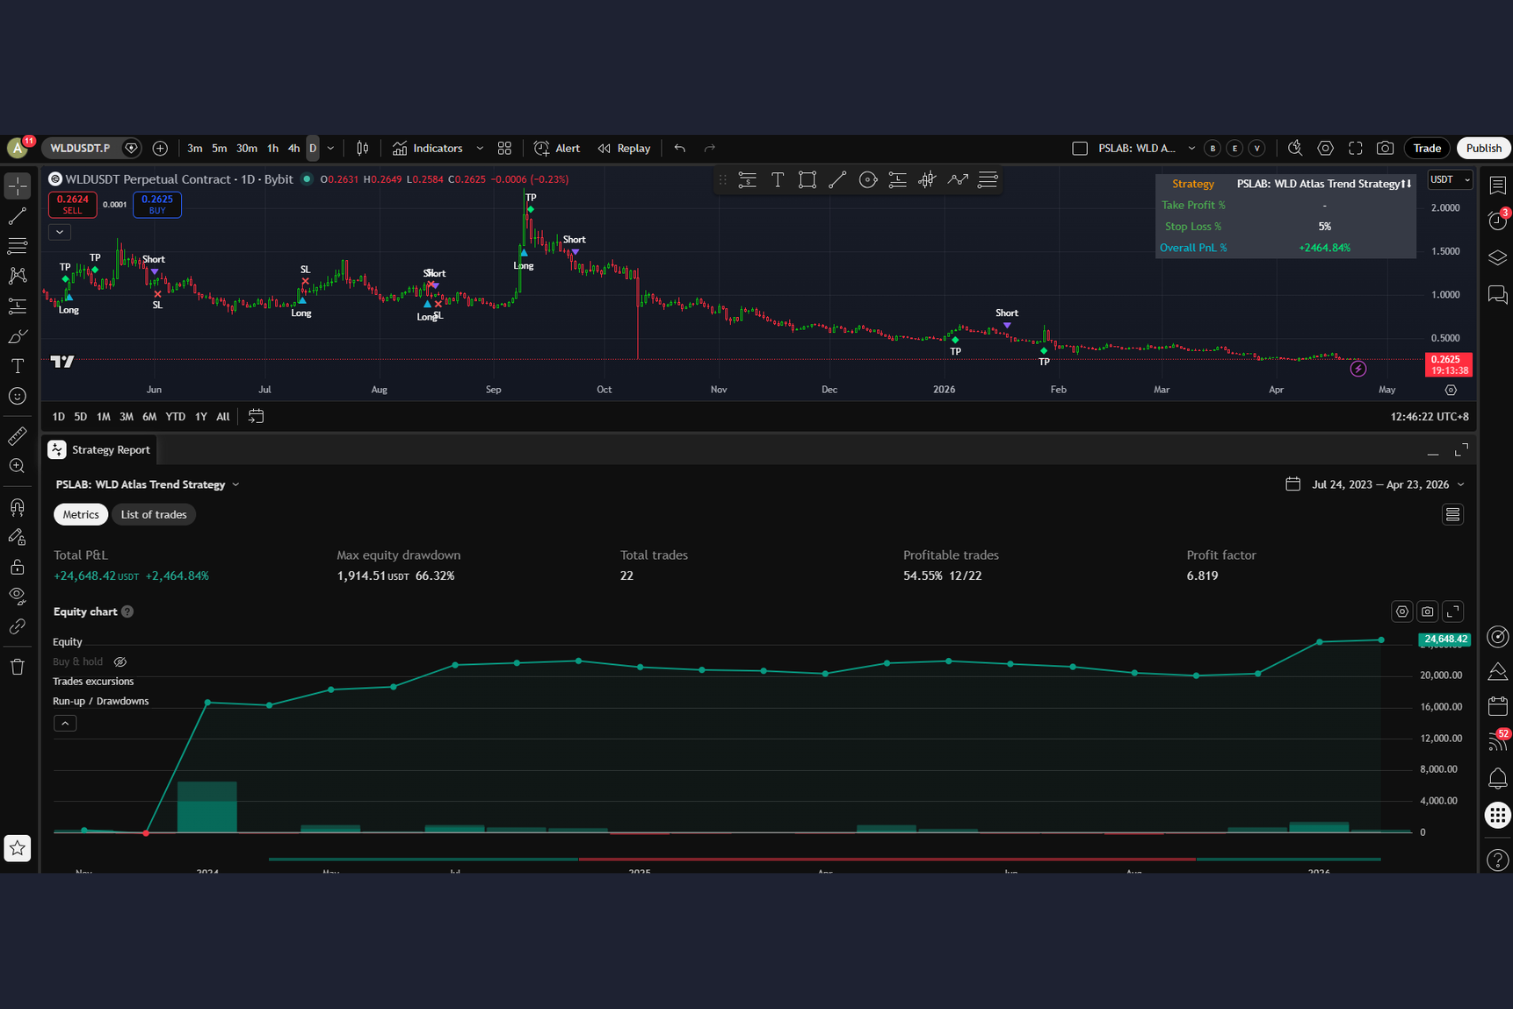
Backtesting Information
Historical performance metrics
Enter your order size and leverage to calculate performance metrics based on the uploaded trading data.
Based on backtests from Oct 23, 2023 to Jan 28, 2026
Basic Information
Core backtest configuration
Trade Statistics
Win/loss and holding behavior
Profit/Loss Summary
Performance highlights and risk
Capital Analysis
Survival buffer for drawdown
Streak Information
Winning and losing patterns
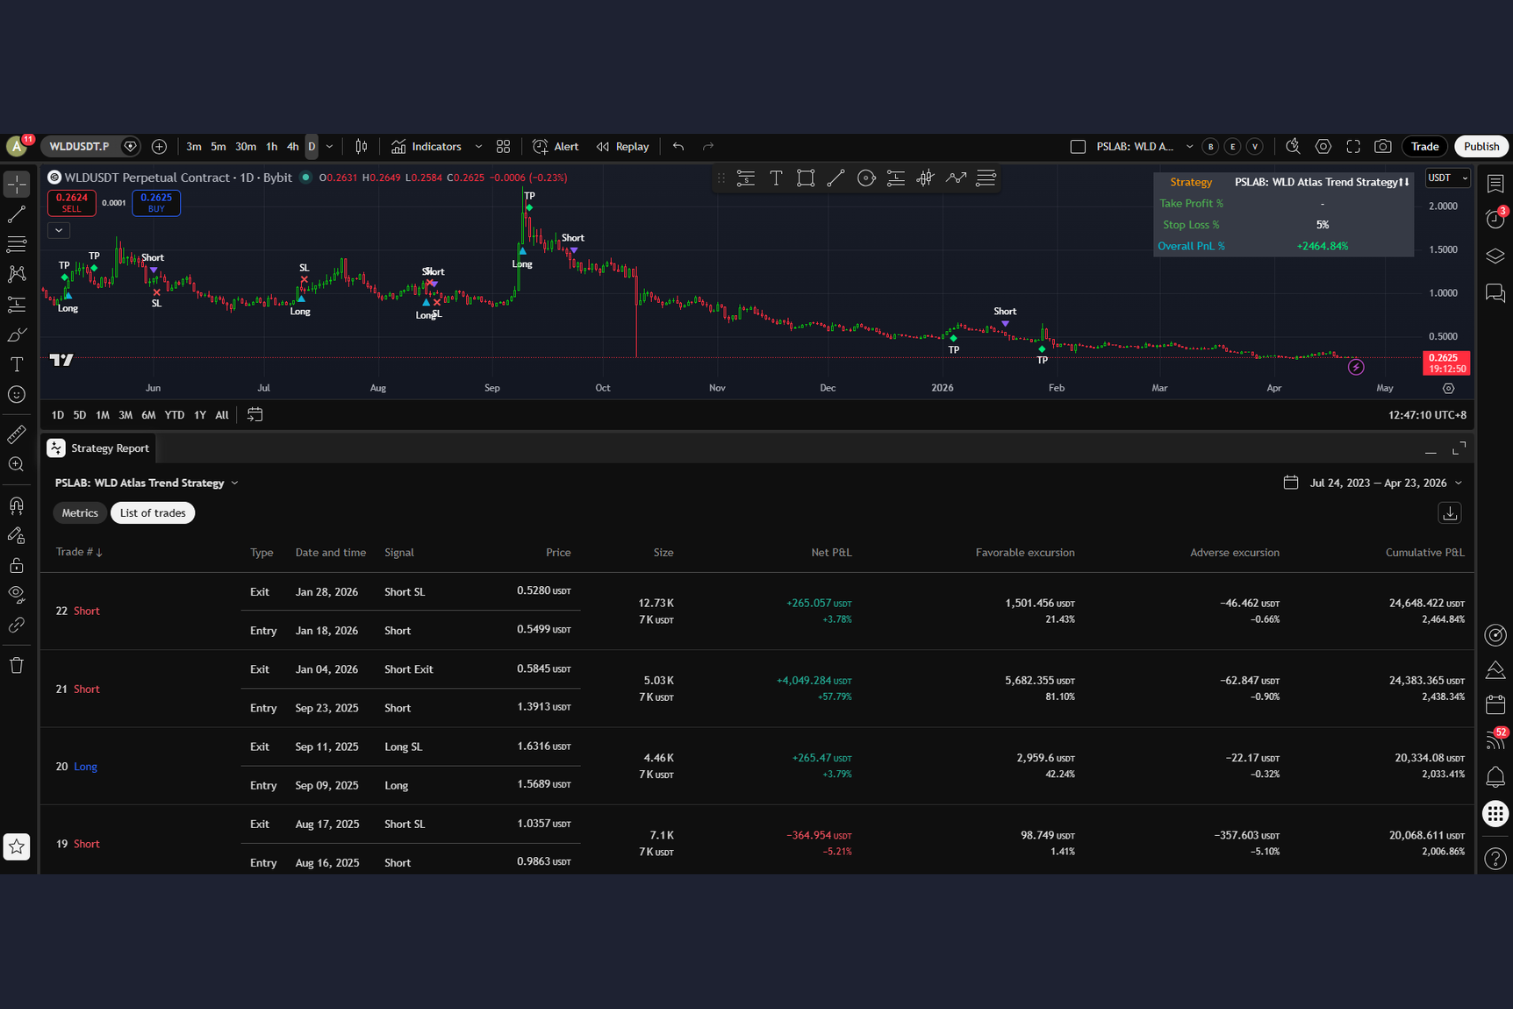
| Trade # ↓ | Type | Date and time | Signal | Price | Position Size | Net P&L | Cumulative Drawdown | Profit at New Peak | Cumulative P&L |
|---|---|---|---|---|---|---|---|---|---|
| 22 Short | Exit | Jan 28, 2026 | Short SL | 0.528 USDT | 12,729.587198 (7,000.00 USDT) | 264.60 USDT (+3.78%) | - | 264.60 USDT (26.46%) | 24,622.50 USDT (2,462.25%) |
| Entry | Jan 18, 2026 | Short | 0.55 USDT | ||||||
| 21 Short | Exit | Jan 04, 2026 | Short Exit | 0.585 USDT | 5,031.265723 (7,000.00 USDT) | 4,045.30 USDT (+57.79%) | - | 2,419.20 USDT (241.92%) | 24,357.90 USDT (2,435.79%) |
| Entry | Sep 23, 2025 | Short | 1.391 USDT | ||||||
| 20 Long | Exit | Sep 11, 2025 | Long SL | 1.632 USDT | 4,461.724776 (7,000.00 USDT) | 265.30 USDT (+3.79%) | -1,626.10 USDT (-162.61%) | - | 20,312.60 USDT (2,031.26%) |
| Entry | Sep 09, 2025 | Long | 1.569 USDT | ||||||
| 19 Short | Exit | Aug 17, 2025 | Short SL | 1.036 USDT | 7,097.23208 (7,000.00 USDT) | -364.70 USDT (-5.21%) | -1,891.40 USDT (-189.14%) | - | 20,047.30 USDT (2,004.73%) |
| Entry | Aug 16, 2025 | Short | 0.986 USDT | ||||||
| 18 Long | Exit | Aug 15, 2025 | Long SL | 0.998 USDT | 6,255.585345 (7,000.00 USDT) | -770.70 USDT (-11.01%) | -1,526.70 USDT (-152.67%) | - | 20,412.00 USDT (2,041.20%) |
| Entry | Aug 14, 2025 | Long | 1.119 USDT | ||||||
| 17 Long | Exit | Jul 12, 2025 | Long SL | 1.014 USDT | 6,556.148731 (7,000.00 USDT) | -363.30 USDT (-5.19%) | -756.00 USDT (-75.60%) | - | 21,182.70 USDT (2,118.27%) |
| Entry | Jul 11, 2025 | Long | 1.068 USDT | ||||||
| 16 Short | Exit | Jun 02, 2025 | Short SL | 1.191 USDT | 6,169.575181 (7,000.00 USDT) | -364.70 USDT (-5.21%) | -392.70 USDT (-39.27%) | - | 21,546.00 USDT (2,154.60%) |
| Entry | Jun 01, 2025 | Short | 1.135 USDT | ||||||
| 15 Long | Exit | May 16, 2025 | Long SL | 1.106 USDT | 6,585.136407 (7,000.00 USDT) | 265.30 USDT (+3.79%) | -28.00 USDT (-2.80%) | - | 21,910.70 USDT (2,191.07%) |
| Entry | May 09, 2025 | Long | 1.063 USDT | ||||||
| 14 Long | Exit | May 08, 2025 | Long Exit | 0.929 USDT | 9,009.00901 (7,000.00 USDT) | 1,348.90 USDT (+19.27%) | -293.30 USDT (-29.33%) | - | 21,645.40 USDT (2,164.54%) |
| Entry | Apr 21, 2025 | Long | 0.777 USDT | ||||||
| 13 Short | Exit | Apr 01, 2025 | Short SL | 0.818 USDT | 8,991.650611 (7,000.00 USDT) | -364.70 USDT (-5.21%) | -1,642.20 USDT (-164.22%) | - | 20,296.50 USDT (2,029.65%) |
| Entry | Mar 30, 2025 | Short | 0.779 USDT | ||||||
| 12 Long | Exit | Jan 26, 2025 | Long Exit | 2.098 USDT | 3,284.842797 (7,000.00 USDT) | -122.50 USDT (-1.75%) | -1,277.50 USDT (-127.75%) | - | 20,661.20 USDT (2,066.12%) |
| Entry | Jan 25, 2025 | Long | 2.131 USDT | ||||||
| 11 Short | Exit | Jan 11, 2025 | Short SL | 2.223 USDT | 3,306.565896 (7,000.00 USDT) | -364.00 USDT (-5.20%) | -1,155.00 USDT (-115.50%) | - | 20,783.70 USDT (2,078.37%) |
| Entry | Jan 10, 2025 | Short | 2.117 USDT | ||||||
| 10 Long | Exit | Jan 08, 2025 | Long SL | 2.326 USDT | 2,674.818495 (7,000.00 USDT) | -791.00 USDT (-11.30%) | -791.00 USDT (-79.10%) | - | 21,147.70 USDT (2,114.77%) |
| Entry | Jan 07, 2025 | Long | 2.617 USDT | ||||||
| 9 Long | Exit | Nov 13, 2024 | Long SL | 2.203 USDT | 3,305.004722 (7,000.00 USDT) | 265.30 USDT (+3.79%) | - | 265.30 USDT (26.53%) | 21,938.70 USDT (2,193.87%) |
| Entry | Nov 11, 2024 | Long | 2.118 USDT | ||||||
| 8 Long | Exit | Oct 01, 2024 | Long SL | 1.619 USDT | 4,495.825306 (7,000.00 USDT) | 265.30 USDT (+3.79%) | - | 265.30 USDT (26.53%) | 21,673.40 USDT (2,167.34%) |
| Entry | Sep 19, 2024 | Long | 1.557 USDT | ||||||
| 7 Short | Exit | Jul 19, 2024 | Short Exit | 2.648 USDT | 1,584.427343 (7,000.00 USDT) | 2,790.20 USDT (+39.86%) | - | 2,790.20 USDT (279.02%) | 21,408.10 USDT (2,140.81%) |
| Entry | Jun 08, 2024 | Short | 4.418 USDT | ||||||
| 6 Short | Exit | Jun 07, 2024 | Short Exit | 4.814 USDT | 1,377.410469 (7,000.00 USDT) | 354.90 USDT (+5.07%) | - | 354.90 USDT (35.49%) | 18,617.90 USDT (1,861.79%) |
| Entry | May 16, 2024 | Short | 5.082 USDT | ||||||
| 5 Short | Exit | May 07, 2024 | Short Exit | 6.001 USDT | 831.057818 (7,000.00 USDT) | 1,998.50 USDT (+28.55%) | - | 1,635.20 USDT (163.52%) | 18,263.00 USDT (1,826.30%) |
| Entry | Mar 29, 2024 | Short | 8.423 USDT | ||||||
| 4 Long | Exit | Mar 28, 2024 | Long SL | 8.315 USDT | 799.725809 (7,000.00 USDT) | -363.30 USDT (-5.19%) | -363.30 USDT (-36.33%) | - | 16,264.50 USDT (1,626.45%) |
| Entry | Mar 27, 2024 | Long | 8.753 USDT | ||||||
| 3 Long | Exit | Mar 21, 2024 | Long Exit | 8.358 USDT | 2,844.372207 (7,000.00 USDT) | 16,725.80 USDT (+238.94%) | - | 16,362.50 USDT (1,636.25%) | 16,627.80 USDT (1,662.78%) |
| Entry | Feb 12, 2024 | Long | 2.461 USDT | ||||||
| 2 Long | Exit | Nov 12, 2023 | Long SL | 1.865 USDT | 3,565.970454 (7,000.00 USDT) | -363.30 USDT (-5.19%) | -363.30 USDT (-36.33%) | - | -98.00 USDT (-9.80%) |
| Entry | Nov 11, 2023 | Long | 1.963 USDT | ||||||
| 1 Long | Exit | Nov 09, 2023 | Long SL | 1.697 USDT | 4,289.215687 (7,000.00 USDT) | 265.30 USDT (+3.79%) | - | 265.30 USDT (26.53%) | 265.30 USDT (26.53%) |
| Entry | Oct 23, 2023 | Long | 1.632 USDT |
| Month | trades | Wins | Losses | Win Rate | Profit | Cumulative Drawdown | Profit at New Peak | Cumulative P&L |
|---|---|---|---|---|---|---|---|---|
| Jan 2026 | 2 | 2 | 0 | 100.00% | 4,309.90 | - | 2,683.80 | 24,622.50 |
| Dec 2025 | 0 | 0 | 0 | 0.00% | - | -1,626.10 | - | 20,312.60 |
| Nov 2025 | 0 | 0 | 0 | 0.00% | - | -1,626.10 | - | 20,312.60 |
| Oct 2025 | 0 | 0 | 0 | 0.00% | - | -1,626.10 | - | 20,312.60 |
| Sep 2025 | 1 | 1 | 0 | 100.00% | 265.30 | -1,626.10 | - | 20,312.60 |
| Aug 2025 | 2 | 0 | 2 | 0.00% | -1,135.40 | -1,891.40 | - | 20,047.30 |
| Jul 2025 | 1 | 0 | 1 | 0.00% | -363.30 | -756.00 | - | 21,182.70 |
| Jun 2025 | 1 | 0 | 1 | 0.00% | -364.70 | -392.70 | - | 21,546.00 |
| May 2025 | 2 | 2 | 0 | 100.00% | 1,614.20 | -28.00 | - | 21,910.70 |
| Apr 2025 | 1 | 0 | 1 | 0.00% | -364.70 | -1,642.20 | - | 20,296.50 |
| Mar 2025 | 0 | 0 | 0 | 0.00% | - | -1,277.50 | - | 20,661.20 |
| Feb 2025 | 0 | 0 | 0 | 0.00% | - | -1,277.50 | - | 20,661.20 |
| Jan 2025 | 3 | 0 | 3 | 0.00% | -1,277.50 | -1,277.50 | - | 20,661.20 |
| Dec 2024 | 0 | 0 | 0 | 0.00% | - | - | - | 21,938.70 |
| Nov 2024 | 1 | 1 | 0 | 100.00% | 265.30 | - | 265.30 | 21,938.70 |
| Oct 2024 | 1 | 1 | 0 | 100.00% | 265.30 | - | 265.30 | 21,673.40 |
| Sep 2024 | 0 | 0 | 0 | 0.00% | - | - | - | 21,408.10 |
| Aug 2024 | 0 | 0 | 0 | 0.00% | - | - | - | 21,408.10 |
| Jul 2024 | 1 | 1 | 0 | 100.00% | 2,790.20 | - | 2,790.20 | 21,408.10 |
| Jun 2024 | 1 | 1 | 0 | 100.00% | 354.90 | - | 354.90 | 18,617.90 |
| May 2024 | 1 | 1 | 0 | 100.00% | 1,998.50 | - | 1,998.50 | 18,263.00 |
| Apr 2024 | 0 | 0 | 0 | 0.00% | - | - | - | 16,264.50 |
| Mar 2024 | 2 | 1 | 1 | 50.00% | 16,362.50 | - | 16,264.50 | 16,264.50 |
| Feb 2024 | 0 | 0 | 0 | 0.00% | - | -98.00 | - | -98.00 |
| Jan 2024 | 0 | 0 | 0 | 0.00% | - | -98.00 | - | -98.00 |
| Dec 2023 | 0 | 0 | 0 | 0.00% | - | -98.00 | - | -98.00 |
| Nov 2023 | 2 | 1 | 1 | 50.00% | -98.00 | -98.00 | - | -98.00 |
| Oct 2023 | 0 | 0 | 0 | 0.00% | - | - | - | - |
| Year | trades | Wins | Losses | Win Rate | Profit | Cumulative Drawdown | Profit at New Peak | Cumulative P&L |
|---|---|---|---|---|---|---|---|---|
| 2026 | 2 | 2 | 0 | 100.00% | 4,309.90 | - | 2,683.80 | 24,622.50 |
| 2025 | 11 | 3 | 8 | 27.27% | -1,626.10 | -1,626.10 | - | 20,312.60 |
| 2024 | 7 | 6 | 1 | 85.71% | 22,036.70 | - | 21,938.70 | 21,938.70 |
| 2023 | 2 | 1 | 1 | 50.00% | -98.00 | -98.00 | - | -98.00 |


Subscribe → submit TradingView username → approval → add script + alerts.
Choose a plan based on how many strategies you want access to.
We use it to grant access to invite-only scripts included in your plan.
Your request is reviewed, then your plan's strategies are enabled for your username.
Add the strategy to your chart, then create alerts for manual trading or webhook automation.
Use this script as part of a rule-based trading workflow. Subscribe to unlock disciplined Pine Scripts, cleaner signal tools, and alert-ready setups built for consistent execution.
Premium TradingView Pine Scripts
Everything you need to know about PinescriptLab
Stop guessing. Use rule-based Pine Scripts for TradingView—designed for cleaner signals, consistent execution, and alert-ready workflows.
Disclaimer: Educational only, not financial advice. Trading involves risk. Past performance is not indicative of future results.