

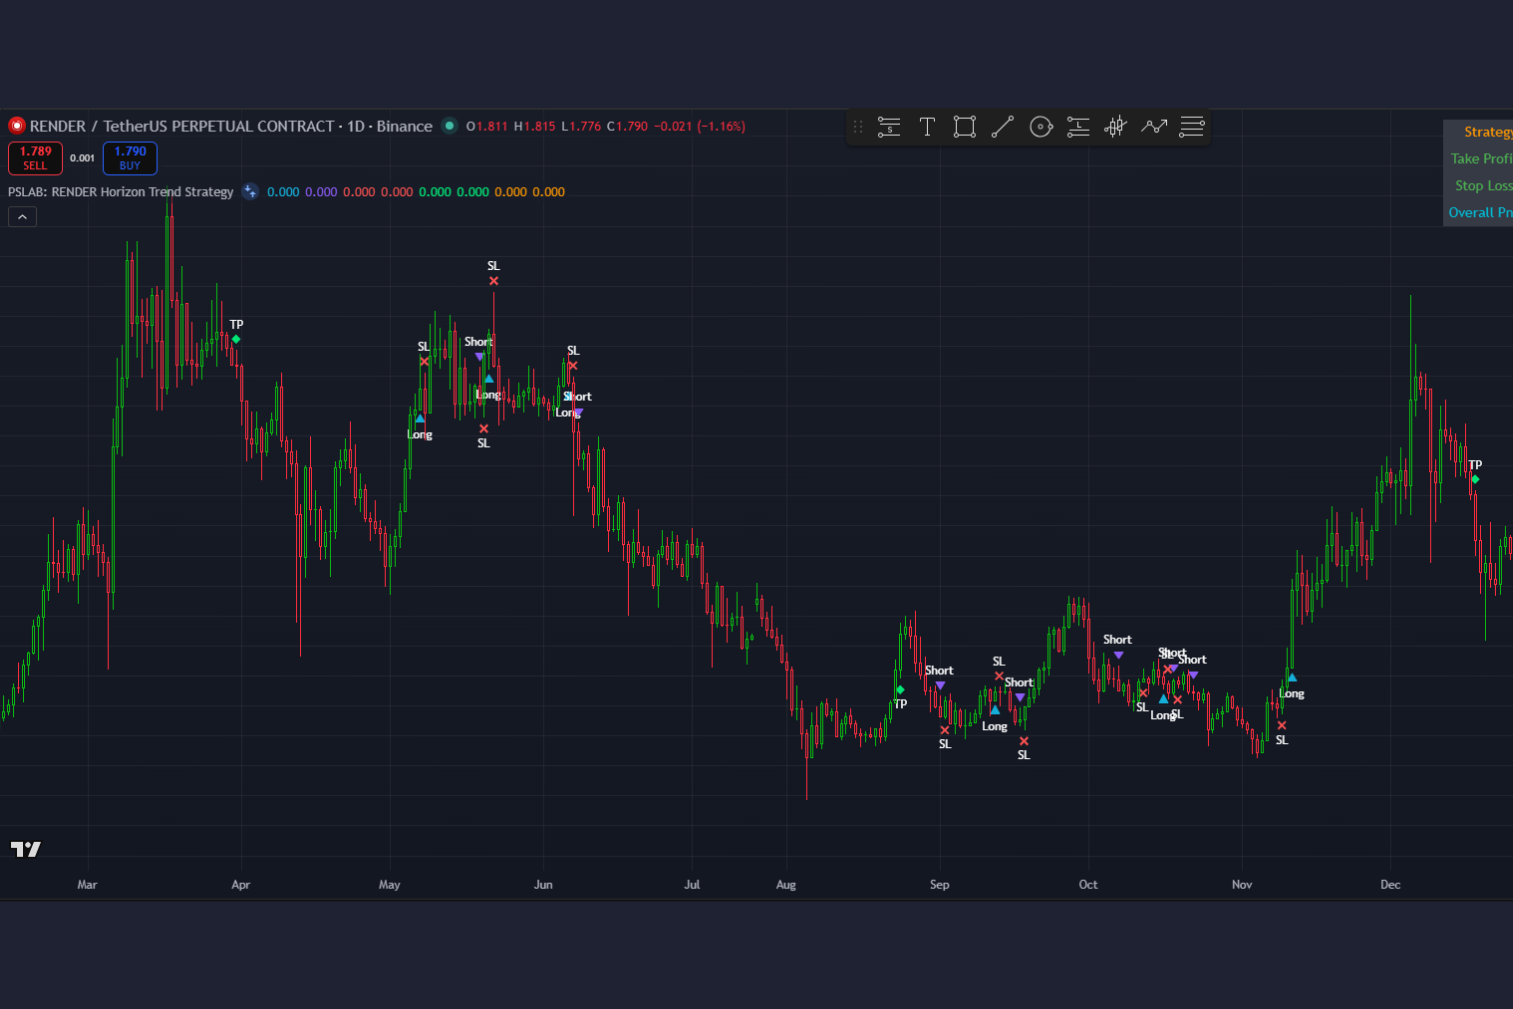
PSLAB: RENDER Horizon Trend Strategy is a premium Daily RENDER trading strategy created for traders who want a more structured and rules-based framework for market participation.
It uses momentum-based trend logic with oscillator confirmation for entries and exits and is built for higher-timeframe trend-following. Suitable for both spot and futures trading, the strategy supports long-only, short-only, or both directions while maintaining a disciplined execution model.
The strategy includes stop loss protection, optional take profit, momentum-based exits, trade-skipping logic, and alert-ready notifications for key trade events. It also supports a broader framework for breakeven behavior depending on configuration, making it suitable for traders who value structure, usability, and controlled execution.
This is a premium strategy for serious traders who want a practical and systematic RENDER trend framework.
Backtesting Information
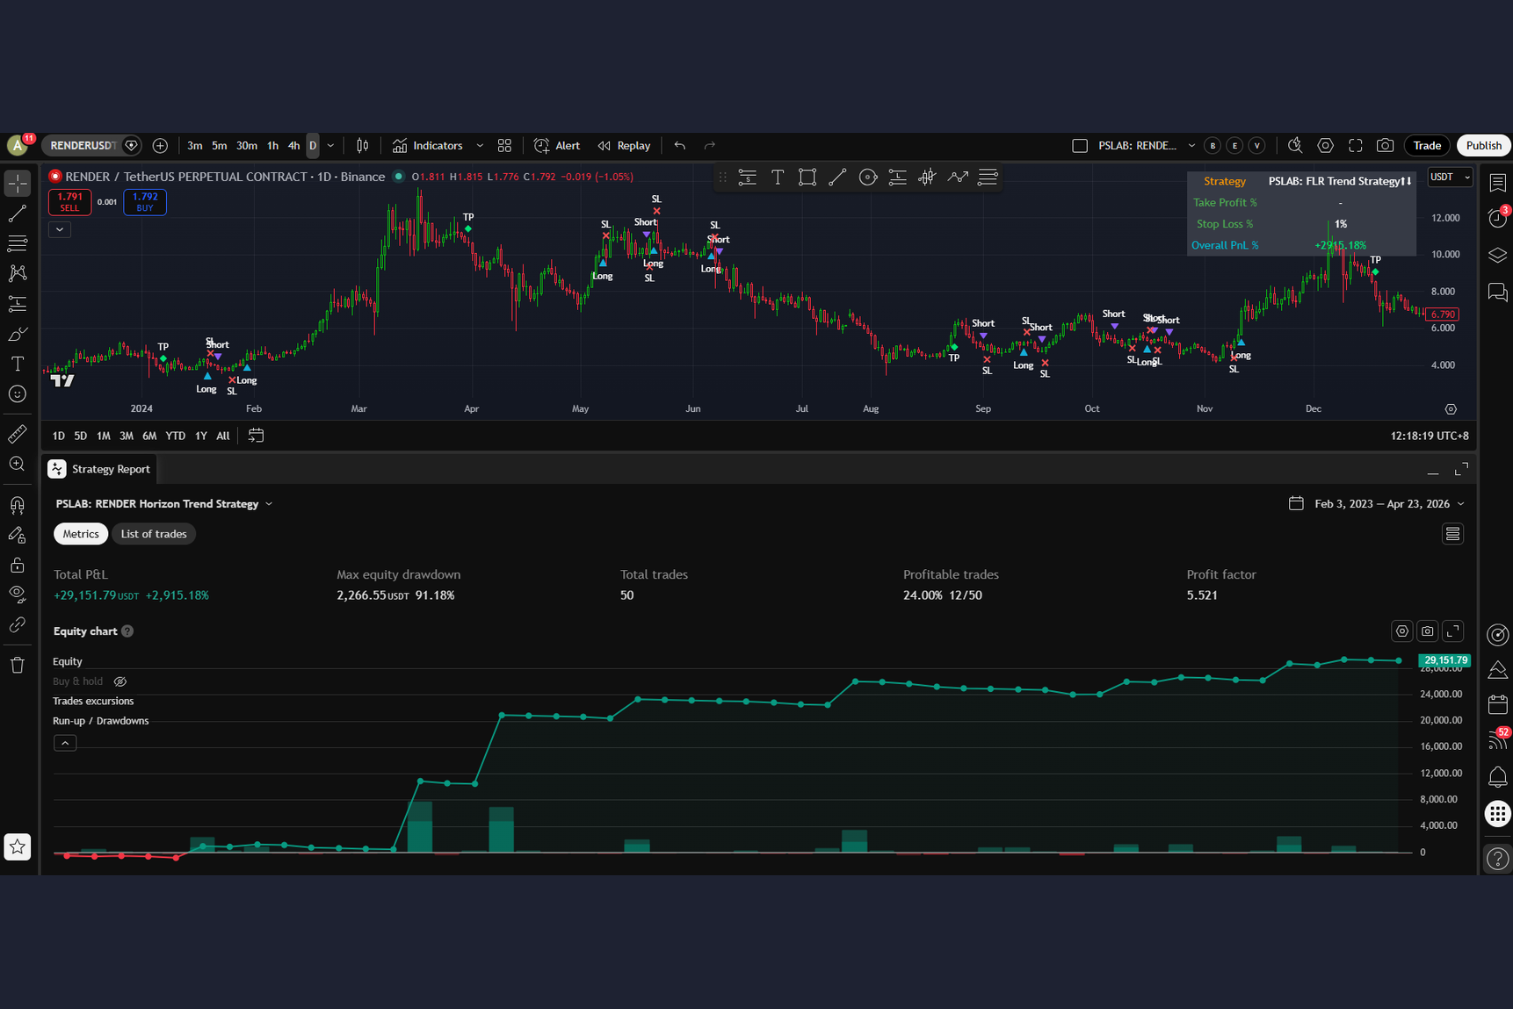
Historical performance metrics
Enter your order size and leverage to calculate performance metrics based on the uploaded trading data.
Based on backtests from Mar 18, 2023 to Apr 20, 2026
Basic Information
Core backtest configuration
Trade Statistics
Win/loss and holding behavior
Profit/Loss Summary
Performance highlights and risk
Capital Analysis
Survival buffer for drawdown
Streak Information
Winning and losing patterns
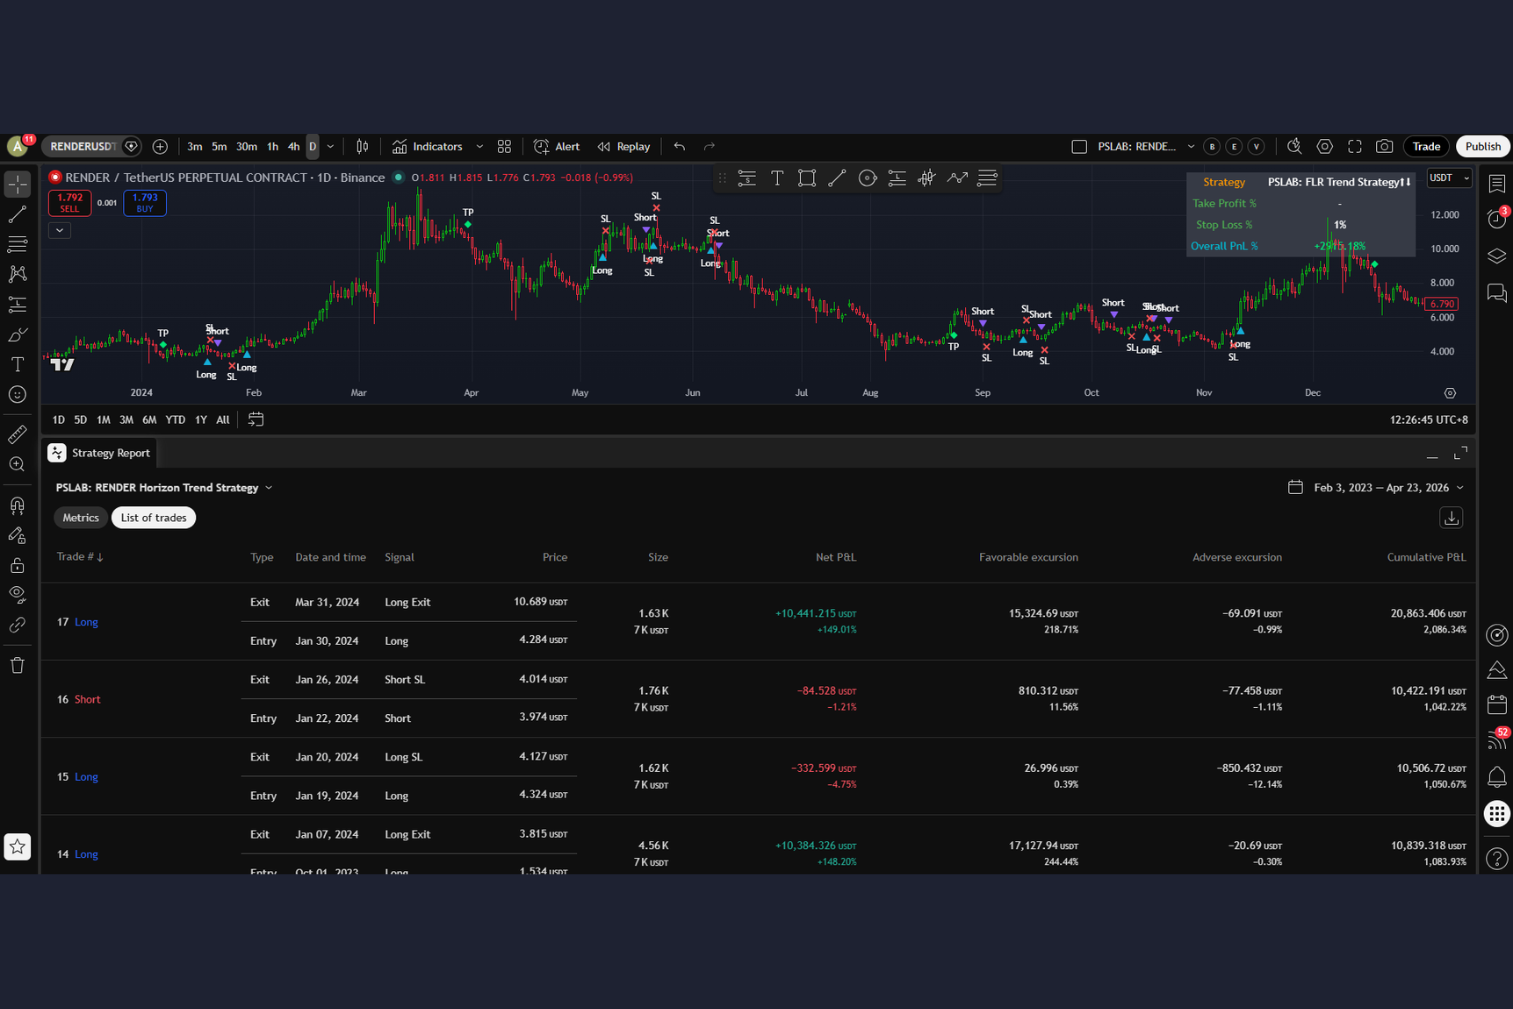
| Trade # ↓ | Type | Date and time | Signal | Price | Position Size | Net P&L | Cumulative Drawdown | Profit at New Peak | Cumulative P&L |
|---|---|---|---|---|---|---|---|---|---|
| 50 Short | Exit | Apr 20, 2026 | Short SL | 1.79 USDT | 3,950.338601 (7,000.00 USDT) | -85.40 USDT (-1.22%) | -171.50 USDT (-17.15%) | - | 29,124.90 USDT (2,912.49%) |
| Entry | Apr 19, 2026 | Short | 1.772 USDT | ||||||
| 49 Long | Exit | Apr 02, 2026 | Long SL | 1.721 USDT | 4,025.301898 (7,000.00 USDT) | -86.10 USDT (-1.23%) | -86.10 USDT (-8.61%) | - | 29,210.30 USDT (2,921.03%) |
| Entry | Apr 01, 2026 | Long | 1.739 USDT | ||||||
| 48 Long | Exit | Mar 30, 2026 | Long Exit | 1.651 USDT | 4,758.667574 (7,000.00 USDT) | 840.70 USDT (+12.01%) | - | 616.00 USDT (61.60%) | 29,296.40 USDT (2,929.64%) |
| Entry | Mar 11, 2026 | Long | 1.471 USDT | ||||||
| 47 Long | Exit | Feb 23, 2026 | Long Exit | 1.415 USDT | 4,797.806717 (7,000.00 USDT) | -224.70 USDT (-3.21%) | -224.70 USDT (-22.47%) | - | 28,455.70 USDT (2,845.57%) |
| Entry | Feb 22, 2026 | Long | 1.459 USDT | ||||||
| 46 Long | Exit | Jan 20, 2026 | Long Exit | 2.073 USDT | 4,617.414249 (7,000.00 USDT) | 2,552.90 USDT (+36.47%) | - | 2,092.30 USDT (209.23%) | 28,680.40 USDT (2,868.04%) |
| Entry | Jan 03, 2026 | Long | 1.516 USDT | ||||||
| 45 Long | Exit | Sep 15, 2025 | Long SL | 3.752 USDT | 1,846.9657 (7,000.00 USDT) | -84.00 USDT (-1.20%) | -460.60 USDT (-46.06%) | - | 26,127.50 USDT (2,612.75%) |
| Entry | Sep 10, 2025 | Long | 3.79 USDT | ||||||
| 44 Short | Exit | Aug 21, 2025 | Short SL | 3.683 USDT | 1,976.284585 (7,000.00 USDT) | -292.60 USDT (-4.18%) | -376.60 USDT (-37.66%) | - | 26,211.50 USDT (2,621.15%) |
| Entry | Aug 20, 2025 | Short | 3.542 USDT | ||||||
| 43 Long | Exit | Aug 11, 2025 | Long SL | 3.934 USDT | 1,761.449422 (7,000.00 USDT) | -84.00 USDT (-1.20%) | -84.00 USDT (-8.40%) | - | 26,504.10 USDT (2,650.41%) |
| Entry | Aug 10, 2025 | Long | 3.974 USDT | ||||||
| 42 Long | Exit | Aug 01, 2025 | Long Exit | 3.723 USDT | 2,085.816449 (7,000.00 USDT) | 749.70 USDT (+10.71%) | - | 626.50 USDT (62.65%) | 26,588.10 USDT (2,658.81%) |
| Entry | Jul 10, 2025 | Long | 3.356 USDT | ||||||
| 41 Short | Exit | Jul 06, 2025 | Short SL | 3.183 USDT | 2,221.516979 (7,000.00 USDT) | -85.40 USDT (-1.22%) | -123.20 USDT (-12.32%) | - | 25,838.40 USDT (2,583.84%) |
| Entry | Jul 05, 2025 | Short | 3.151 USDT | ||||||
| 40 Short | Exit | Jul 04, 2025 | Short Exit | 3.305 USDT | 1,535.761299 (7,000.00 USDT) | 1,910.30 USDT (+27.29%) | -37.80 USDT (-3.78%) | - | 25,923.80 USDT (2,592.38%) |
| Entry | May 28, 2025 | Short | 4.558 USDT | ||||||
| 39 Short | Exit | May 27, 2025 | Short Exit | 4.741 USDT | 1,464.741578 (7,000.00 USDT) | 42.00 USDT (+0.60%) | -1,948.10 USDT (-194.81%) | - | 24,013.50 USDT (2,401.35%) |
| Entry | May 26, 2025 | Short | 4.779 USDT | ||||||
| 38 Long | Exit | May 24, 2025 | Long SL | 4.666 USDT | 1,353.179973 (7,000.00 USDT) | -698.60 USDT (-9.98%) | -1,990.10 USDT (-199.01%) | - | 23,971.50 USDT (2,397.15%) |
| Entry | May 23, 2025 | Long | 5.173 USDT | ||||||
| 37 Short | Exit | May 20, 2025 | Short SL | 4.724 USDT | 1,496.68591 (7,000.00 USDT) | -84.00 USDT (-1.20%) | -1,291.50 USDT (-129.15%) | - | 24,670.10 USDT (2,467.01%) |
| Entry | May 19, 2025 | Short | 4.677 USDT | ||||||
| 36 Short | Exit | Apr 09, 2025 | Short SL | 3.333 USDT | 2,121.212122 (7,000.00 USDT) | -84.00 USDT (-1.20%) | -1,207.50 USDT (-120.75%) | - | 24,754.10 USDT (2,475.41%) |
| Entry | Apr 04, 2025 | Short | 3.3 USDT | ||||||
| 35 Long | Exit | Apr 02, 2025 | Long SL | 3.281 USDT | 2,111.613877 (7,000.00 USDT) | -85.40 USDT (-1.22%) | -1,123.50 USDT (-112.35%) | - | 24,838.10 USDT (2,483.81%) |
| Entry | Mar 23, 2025 | Long | 3.315 USDT | ||||||
| 34 Long | Exit | Mar 22, 2025 | Long Exit | 3.21 USDT | 2,110.977081 (7,000.00 USDT) | -237.30 USDT (-3.39%) | -1,038.10 USDT (-103.81%) | - | 24,923.50 USDT (2,492.35%) |
| Entry | Mar 21, 2025 | Long | 3.316 USDT | ||||||
| 33 Long | Exit | Jan 19, 2025 | Long SL | 7.475 USDT | 879.396985 (7,000.00 USDT) | -439.60 USDT (-6.28%) | -800.80 USDT (-80.08%) | - | 25,160.80 USDT (2,516.08%) |
| Entry | Jan 18, 2025 | Long | 7.96 USDT | ||||||
| 32 Short | Exit | Jan 11, 2025 | Short SL | 7.287 USDT | 996.725047 (7,000.00 USDT) | -277.20 USDT (-3.96%) | -361.20 USDT (-36.12%) | - | 25,600.40 USDT (2,560.04%) |
| Entry | Jan 10, 2025 | Short | 7.023 USDT | ||||||
| 31 Long | Exit | Jan 08, 2025 | Long SL | 7.98 USDT | 868.378614 (7,000.00 USDT) | -84.00 USDT (-1.20%) | -84.00 USDT (-8.40%) | - | 25,877.60 USDT (2,587.76%) |
| Entry | Jan 05, 2025 | Long | 8.061 USDT | ||||||
| 30 Long | Exit | Dec 18, 2024 | Long Exit | 8.526 USDT | 1,241.134752 (7,000.00 USDT) | 3,560.90 USDT (+50.87%) | - | 2,706.90 USDT (270.69%) | 25,961.60 USDT (2,596.16%) |
| Entry | Nov 11, 2024 | Long | 5.64 USDT | ||||||
| 29 Short | Exit | Nov 09, 2024 | Short SL | 5.287 USDT | 1,337.409248 (7,000.00 USDT) | -84.70 USDT (-1.21%) | -854.00 USDT (-85.40%) | - | 22,400.70 USDT (2,240.07%) |
| Entry | Oct 22, 2024 | Short | 5.234 USDT | ||||||
| 28 Short | Exit | Oct 19, 2024 | Short SL | 5.411 USDT | 1,341.253114 (7,000.00 USDT) | -271.60 USDT (-3.88%) | -769.30 USDT (-76.93%) | - | 22,485.40 USDT (2,248.54%) |
| Entry | Oct 18, 2024 | Short | 5.219 USDT | ||||||
| 27 Long | Exit | Oct 17, 2024 | Long SL | 5.366 USDT | 1,277.139209 (7,000.00 USDT) | -160.30 USDT (-2.29%) | -497.70 USDT (-49.77%) | - | 22,757.00 USDT (2,275.70%) |
| Entry | Oct 16, 2024 | Long | 5.481 USDT | ||||||
| 26 Short | Exit | Oct 12, 2024 | Short SL | 5.486 USDT | 1,288.897073 (7,000.00 USDT) | -84.70 USDT (-1.21%) | -337.40 USDT (-33.74%) | - | 22,917.30 USDT (2,291.73%) |
| Entry | Oct 07, 2024 | Short | 5.431 USDT | ||||||
| 25 Short | Exit | Sep 18, 2024 | Short SL | 4.784 USDT | 1,478.040541 (7,000.00 USDT) | -84.70 USDT (-1.21%) | -252.70 USDT (-25.27%) | - | 23,002.00 USDT (2,300.20%) |
| Entry | Sep 17, 2024 | Short | 4.736 USDT | ||||||
| 24 Long | Exit | Sep 13, 2024 | Long SL | 5.032 USDT | 1,377.139485 (7,000.00 USDT) | -84.00 USDT (-1.20%) | -168.00 USDT (-16.80%) | - | 23,086.70 USDT (2,308.67%) |
| Entry | Sep 12, 2024 | Long | 5.083 USDT | ||||||
| 23 Short | Exit | Sep 02, 2024 | Short SL | 5.042 USDT | 1,402.24359 (7,000.00 USDT) | -84.00 USDT (-1.20%) | -84.00 USDT (-8.40%) | - | 23,170.70 USDT (2,317.07%) |
| Entry | Sep 01, 2024 | Short | 4.992 USDT | ||||||
| 22 Short | Exit | Aug 24, 2024 | Short Exit | 5.597 USDT | 731.070497 (7,000.00 USDT) | 2,894.50 USDT (+41.35%) | - | 2,412.90 USDT (241.29%) | 23,254.70 USDT (2,325.47%) |
| Entry | Jun 08, 2024 | Short | 9.575 USDT | ||||||
| 21 Long | Exit | Jun 07, 2024 | Long SL | 10.382 USDT | 653.472741 (7,000.00 USDT) | -228.90 USDT (-3.27%) | -481.60 USDT (-48.16%) | - | 20,360.20 USDT (2,036.02%) |
| Entry | Jun 06, 2024 | Long | 10.712 USDT | ||||||
| 20 Long | Exit | May 22, 2024 | Long SL | 10.767 USDT | 643.618978 (7,000.00 USDT) | -84.00 USDT (-1.20%) | -252.70 USDT (-25.27%) | - | 20,589.10 USDT (2,058.91%) |
| Entry | May 21, 2024 | Long | 10.876 USDT | ||||||
| 19 Short | Exit | May 20, 2024 | Short SL | 10.433 USDT | 677.703554 (7,000.00 USDT) | -84.70 USDT (-1.21%) | -168.70 USDT (-16.87%) | - | 20,673.10 USDT (2,067.31%) |
| Entry | May 19, 2024 | Short | 10.329 USDT | ||||||
| 18 Long | Exit | May 08, 2024 | Long SL | 9.842 USDT | 704.083686 (7,000.00 USDT) | -84.00 USDT (-1.20%) | -84.00 USDT (-8.40%) | - | 20,757.80 USDT (2,075.78%) |
| Entry | May 07, 2024 | Long | 9.942 USDT | ||||||
| 17 Long | Exit | Mar 31, 2024 | Long Exit | 10.689 USDT | 1,633.986929 (7,000.00 USDT) | 10,430.70 USDT (+149.01%) | - | 10,013.50 USDT (1,001.35%) | 20,841.80 USDT (2,084.18%) |
| Entry | Jan 30, 2024 | Long | 4.284 USDT | ||||||
| 16 Short | Exit | Jan 26, 2024 | Short SL | 4.014 USDT | 1,761.449422 (7,000.00 USDT) | -84.70 USDT (-1.21%) | -417.20 USDT (-41.72%) | - | 10,411.10 USDT (1,041.11%) |
| Entry | Jan 22, 2024 | Short | 3.974 USDT | ||||||
| 15 Long | Exit | Jan 20, 2024 | Long SL | 4.127 USDT | 1,618.871416 (7,000.00 USDT) | -332.50 USDT (-4.75%) | -332.50 USDT (-33.25%) | - | 10,495.80 USDT (1,049.58%) |
| Entry | Jan 19, 2024 | Long | 4.324 USDT | ||||||
| 14 Long | Exit | Jan 07, 2024 | Long Exit | 3.815 USDT | 4,563.233377 (7,000.00 USDT) | 10,374.00 USDT (+148.20%) | - | 9,619.40 USDT (961.94%) | 10,828.30 USDT (1,082.83%) |
| Entry | Oct 01, 2023 | Long | 1.534 USDT | ||||||
| 13 Short | Exit | Sep 28, 2023 | Short SL | 1.502 USDT | 4,707.464695 (7,000.00 USDT) | -84.70 USDT (-1.21%) | -754.60 USDT (-75.46%) | - | 454.30 USDT (45.43%) |
| Entry | Sep 27, 2023 | Short | 1.487 USDT | ||||||
| 12 Long | Exit | Sep 11, 2023 | Long SL | 1.477 USDT | 4,676.018705 (7,000.00 USDT) | -107.10 USDT (-1.53%) | -669.90 USDT (-66.99%) | - | 539.00 USDT (53.90%) |
| Entry | Sep 10, 2023 | Long | 1.497 USDT | ||||||
| 11 Long | Exit | Jul 16, 2023 | Long SL | 2.009 USDT | 3,448.275863 (7,000.00 USDT) | -86.10 USDT (-1.23%) | -562.80 USDT (-56.28%) | - | 646.10 USDT (64.61%) |
| Entry | Jul 15, 2023 | Long | 2.03 USDT | ||||||
| 10 Long | Exit | Jul 06, 2023 | Long Exit | 1.962 USDT | 3,375.120541 (7,000.00 USDT) | -391.30 USDT (-5.59%) | -476.70 USDT (-47.67%) | - | 732.20 USDT (73.22%) |
| Entry | Jul 05, 2023 | Long | 2.074 USDT | ||||||
| 9 Short | Exit | Jun 27, 2023 | Short SL | 2.084 USDT | 3,393.116821 (7,000.00 USDT) | -85.40 USDT (-1.22%) | -85.40 USDT (-8.54%) | - | 1,123.50 USDT (112.35%) |
| Entry | Jun 26, 2023 | Short | 2.063 USDT | ||||||
| 8 Short | Exit | Jun 22, 2023 | Short Exit | 2.286 USDT | 2,898.550725 (7,000.00 USDT) | 359.80 USDT (+5.14%) | - | 273.00 USDT (27.30%) | 1,208.90 USDT (120.89%) |
| Entry | Jun 07, 2023 | Short | 2.415 USDT | ||||||
| 7 Long | Exit | May 20, 2023 | Long SL | 2.278 USDT | 3,040.834058 (7,000.00 USDT) | -86.80 USDT (-1.24%) | -86.80 USDT (-8.68%) | - | 849.10 USDT (84.91%) |
| Entry | May 18, 2023 | Long | 2.302 USDT | ||||||
| 6 Long | Exit | May 09, 2023 | Long Exit | 1.858 USDT | 4,726.536125 (7,000.00 USDT) | 1,764.70 USDT (+25.21%) | - | 935.90 USDT (93.59%) | 935.90 USDT (93.59%) |
| Entry | Apr 11, 2023 | Long | 1.481 USDT | ||||||
| 5 Short | Exit | Apr 10, 2023 | Short SL | 1.305 USDT | 5,511.811024 (7,000.00 USDT) | -207.20 USDT (-2.96%) | -828.80 USDT (-82.88%) | - | -828.80 USDT (-82.88%) |
| Entry | Apr 09, 2023 | Short | 1.27 USDT | ||||||
| 4 Long | Exit | Apr 06, 2023 | Long SL | 1.317 USDT | 5,259.203607 (7,000.00 USDT) | -87.50 USDT (-1.25%) | -621.60 USDT (-62.16%) | - | -621.60 USDT (-62.16%) |
| Entry | Apr 05, 2023 | Long | 1.331 USDT | ||||||
| 3 Long | Exit | Apr 04, 2023 | Long Exit | 1.293 USDT | 5,490.196079 (7,000.00 USDT) | 84.70 USDT (+1.21%) | -534.10 USDT (-53.41%) | - | -534.10 USDT (-53.41%) |
| Entry | Apr 03, 2023 | Long | 1.275 USDT | ||||||
| 2 Short | Exit | Mar 31, 2023 | Short SL | 1.345 USDT | 5,259.203607 (7,000.00 USDT) | -87.50 USDT (-1.25%) | -618.80 USDT (-61.88%) | - | -618.80 USDT (-61.88%) |
| Entry | Mar 24, 2023 | Short | 1.331 USDT | ||||||
| 1 Long | Exit | Mar 19, 2023 | Long SL | 1.463 USDT | 4,430.379747 (7,000.00 USDT) | -531.30 USDT (-7.59%) | -531.30 USDT (-53.13%) | - | -531.30 USDT (-53.13%) |
| Entry | Mar 18, 2023 | Long | 1.58 USDT |
| Month | trades | Wins | Losses | Win Rate | Profit | Cumulative Drawdown | Profit at New Peak | Cumulative P&L |
|---|---|---|---|---|---|---|---|---|
| Apr 2026 | 2 | 0 | 2 | 0.00% | -171.50 | -171.50 | - | 29,124.90 |
| Mar 2026 | 1 | 1 | 0 | 100.00% | 840.70 | - | 616.00 | 29,296.40 |
| Feb 2026 | 1 | 0 | 1 | 0.00% | -224.70 | -224.70 | - | 28,455.70 |
| Jan 2026 | 1 | 1 | 0 | 100.00% | 2,552.90 | - | 2,468.90 | 28,680.40 |
| Dec 2025 | 0 | 0 | 0 | 0.00% | - | -84.00 | - | 26,127.50 |
| Nov 2025 | 0 | 0 | 0 | 0.00% | - | -84.00 | - | 26,127.50 |
| Oct 2025 | 0 | 0 | 0 | 0.00% | - | -84.00 | - | 26,127.50 |
| Sep 2025 | 1 | 0 | 1 | 0.00% | -84.00 | -84.00 | - | 26,127.50 |
| Aug 2025 | 3 | 1 | 2 | 33.33% | 373.10 | - | 249.90 | 26,211.50 |
| Jul 2025 | 2 | 1 | 1 | 50.00% | 1,824.90 | -123.20 | - | 25,838.40 |
| Jun 2025 | 0 | 0 | 0 | 0.00% | - | -1,948.10 | - | 24,013.50 |
| May 2025 | 3 | 1 | 2 | 33.33% | -740.60 | -1,948.10 | - | 24,013.50 |
| Apr 2025 | 2 | 0 | 2 | 0.00% | -169.40 | -1,207.50 | - | 24,754.10 |
| Mar 2025 | 1 | 0 | 1 | 0.00% | -237.30 | -1,038.10 | - | 24,923.50 |
| Feb 2025 | 0 | 0 | 0 | 0.00% | - | -800.80 | - | 25,160.80 |
| Jan 2025 | 3 | 0 | 3 | 0.00% | -800.80 | -800.80 | - | 25,160.80 |
| Dec 2024 | 1 | 1 | 0 | 100.00% | 3,560.90 | - | 2,706.90 | 25,961.60 |
| Nov 2024 | 1 | 0 | 1 | 0.00% | -84.70 | -854.00 | - | 22,400.70 |
| Oct 2024 | 3 | 0 | 3 | 0.00% | -516.60 | -769.30 | - | 22,485.40 |
| Sep 2024 | 3 | 0 | 3 | 0.00% | -252.70 | -252.70 | - | 23,002.00 |
| Aug 2024 | 1 | 1 | 0 | 100.00% | 2,894.50 | - | 2,412.90 | 23,254.70 |
| Jul 2024 | 0 | 0 | 0 | 0.00% | - | -481.60 | - | 20,360.20 |
| Jun 2024 | 1 | 0 | 1 | 0.00% | -228.90 | -481.60 | - | 20,360.20 |
| May 2024 | 3 | 0 | 3 | 0.00% | -252.70 | -252.70 | - | 20,589.10 |
| Apr 2024 | 0 | 0 | 0 | 0.00% | - | - | - | 20,841.80 |
| Mar 2024 | 1 | 1 | 0 | 100.00% | 10,430.70 | - | 10,430.70 | 20,841.80 |
| Feb 2024 | 0 | 0 | 0 | 0.00% | - | - | - | 10,411.10 |
| Jan 2024 | 3 | 1 | 2 | 33.33% | 9,956.80 | - | 9,287.60 | 10,411.10 |
| Dec 2023 | 0 | 0 | 0 | 0.00% | - | -669.20 | - | 454.30 |
| Nov 2023 | 0 | 0 | 0 | 0.00% | - | -669.20 | - | 454.30 |
| Oct 2023 | 0 | 0 | 0 | 0.00% | - | -669.20 | - | 454.30 |
| Sep 2023 | 2 | 0 | 2 | 0.00% | -191.80 | -669.20 | - | 454.30 |
| Aug 2023 | 0 | 0 | 0 | 0.00% | - | -477.40 | - | 646.10 |
| Jul 2023 | 2 | 0 | 2 | 0.00% | -477.40 | -477.40 | - | 646.10 |
| Jun 2023 | 2 | 1 | 1 | 50.00% | 274.40 | - | 274.40 | 1,123.50 |
| May 2023 | 2 | 1 | 1 | 50.00% | 1,677.90 | - | 849.10 | 849.10 |
| Apr 2023 | 3 | 1 | 2 | 33.33% | -210.00 | -828.80 | - | -828.80 |
| Mar 2023 | 2 | 0 | 2 | 0.00% | -618.80 | -618.80 | - | -618.80 |
| Year | trades | Wins | Losses | Win Rate | Profit | Cumulative Drawdown | Profit at New Peak | Cumulative P&L |
|---|---|---|---|---|---|---|---|---|
| 2026 | 5 | 2 | 3 | 40.00% | 2,997.40 | - | 2,997.40 | 29,124.90 |
| 2025 | 15 | 3 | 12 | 20.00% | 165.90 | - | 165.90 | 26,127.50 |
| 2024 | 17 | 4 | 13 | 23.53% | 25,507.30 | - | 25,507.30 | 25,961.60 |
| 2023 | 13 | 3 | 10 | 23.08% | 454.30 | - | 454.30 | 454.30 |


Subscribe → submit TradingView username → approval → add script + alerts.
Choose a plan based on how many strategies you want access to.
We use it to grant access to invite-only scripts included in your plan.
Your request is reviewed, then your plan's strategies are enabled for your username.
Add the strategy to your chart, then create alerts for manual trading or webhook automation.
Use this script as part of a rule-based trading workflow. Subscribe to unlock disciplined Pine Scripts, cleaner signal tools, and alert-ready setups built for consistent execution.
Premium TradingView Pine Scripts
Everything you need to know about PinescriptLab
Stop guessing. Use rule-based Pine Scripts for TradingView—designed for cleaner signals, consistent execution, and alert-ready workflows.
Disclaimer: Educational only, not financial advice. Trading involves risk. Past performance is not indicative of future results.